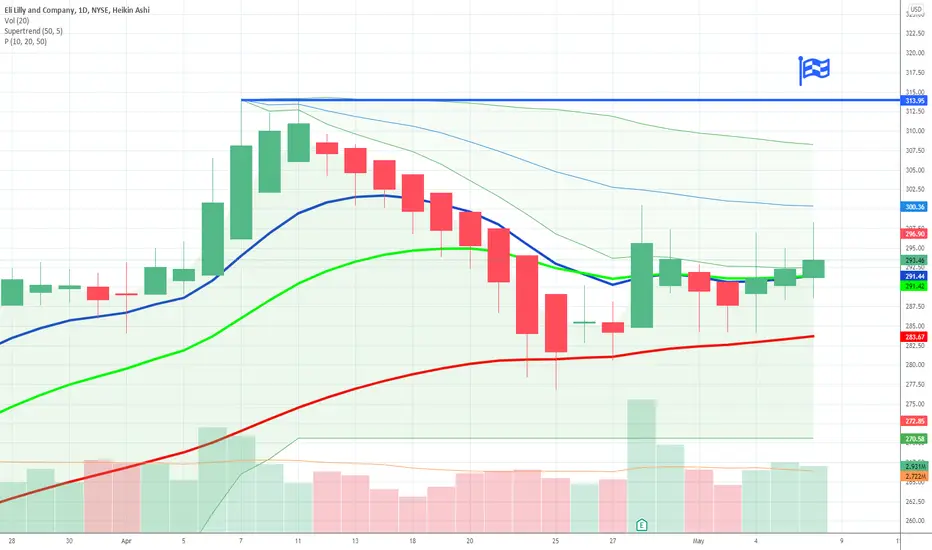
$LLY Volatility Contracting$LLY one I am watching - holding up good and orange shade showing up on the chart indicating volatility contracting.
Would like to see volume drying up here.
LLY trade ideas

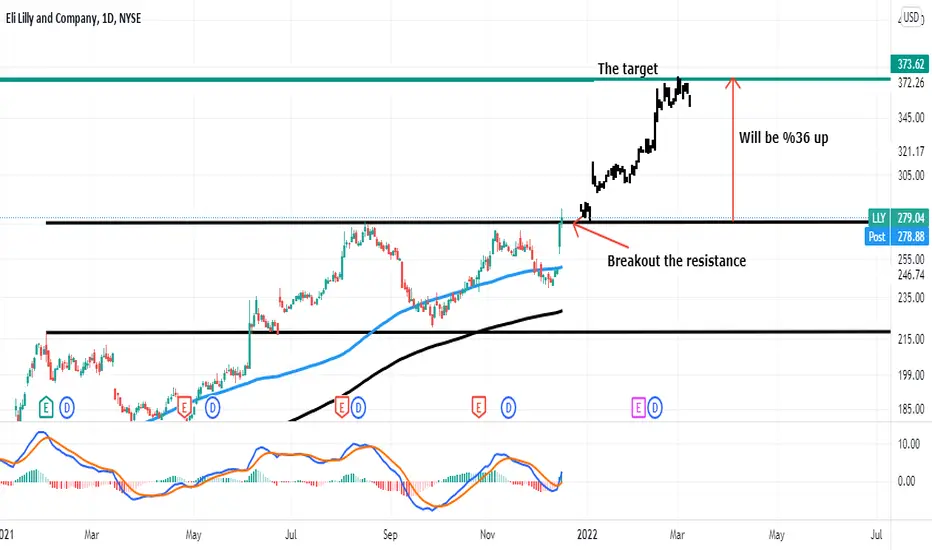
$LLY Breakout - Target 313$Same rational as always: Strong Up move - consolidation - reclaim of lower vwap band - let the show begin :) Target 313$
$LLY with a Bullish outlook following its earnings #Stocks The PEAD projected a Bullish outlook for $LLY after a Positive over reaction following its earnings release placing the stock in drift B with an expected accuracy of 66.67%.
LLY at resistance and overbought historicallyWay overbought on all technicals, looking for a pullback to $270 range in the next week or so. Will add every $2 increase in stock price up. Will cover at or under target.

Eli Lilly USA Sun Storm Investment Trading Desk & NexGen Wealth Management Service Present's: SSITD & NexGen Portfolio of the Week Series
Focus: Worldwide
By Sun Storm Investment Research & NexGen Wealth Management Service
A Profit & Solutions Strategy & Research
Trading | Investment | Stocks | ETF | Mutual Funds | Crypto | Bonds | Options | Dividend | Futures |
USA | Canada | UK | Germany | France | Italy | Rest of Europe | Mexico | India
Disclaimer: Sun Storm Investment and NexGen are not registered financial advisors, so please do your own research before trading & investing anything. This is information is for only research purposes not for actual trading & investing decision.
#debadipb #profitsolutions

3/13/22 LLYEli Lilly and Company ( NYSE:LLY )
Sector: Health Technology (Pharmaceuticals: Major)
Market Capitalization: $253.61B
Current Price: $266.30
Breakout price: $270.95 (hold above)
Buy Zone (Top/Bottom Range): $262.45-$247.10
Price Target: $308.00-$310.40
Estimated Duration to Target: 84-90d
Contract of Interest: $LLY 6/17/22 300c
Trade price as of publish date: $5.90/contract

Eli Lilly up and up. LLYShort term and temporarily.
Immediate targets 257, 263, 272. Invalidation 232.
We are not in the business of getting every prediction right, no one ever does and that is not the aim of the game. The Fibonacci targets are highlighted in green with invalidation in red. Fibonacci goals, it is prudent to suggest, are nothing more than mere fractally evident and therefore statistically likely levels that the market will go to. Having said that, the market will always do what it wants and always has a mind of its own. Therefore, none of this is financial advice, so do your own research and rely only on your own analysis. Trading is a true one man sport. Good luck out there and stay safe

$LLY with a Bullish outlook following its earnings #Stocks The PEAD projected a Bullish outlook for $LLY after a Negative Under reaction following its earnings release placing the stock in drift D with an expected accuracy of 40%.


US FDA approves Jardiance® (empagliflozin) to treat adults with LLY: Eli Lilly and Company
2022-02-24 16:00:00
US FDA approves Jardiance® (empagliflozin) to treat adults with heart failure regardless of left ventricular ejection fraction

LLY short biased LLY forming a nice harmonic that i would like to see pull back don to the trendline in the rising wedge.lots of divergence on higher time frames. the move has already started so maybe look to try and see a pop to go back in short.
Not financial advice

Symmetrical TrianglePrice broke upper trendline of triangle on the 5th touch then a throwback occurred. Price is back in the symmetrical triangle again. Not quite to long entry level.
This pattern is neutral until a trendline is broken with a trend in that direction.
Todays candle at the moment I write this is a Doji, a candle of indecision
If price breaks upward, then possible stop under top trendline.
No recommendation

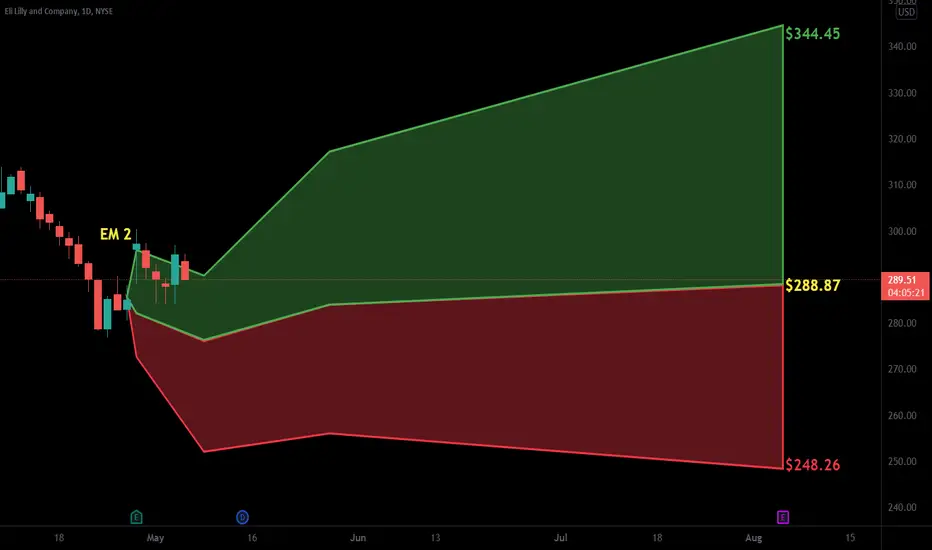
Eli Lilly and Company, Daily Chart Eli Lilly and Company is Pharmaceutical company.. I see amazing buying opportunity, and great target by %36 up.
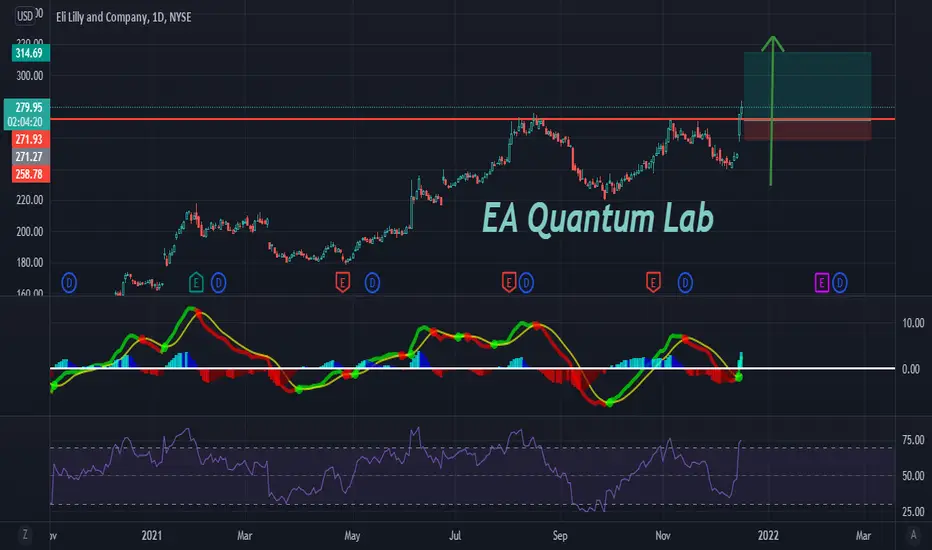
Go to the ATH!The stock broke through a good resistance level and is steadily moving higher. We expect growth up to $315 per share. Products of this company are in demand.
❤️ If you find this helpful and want more FREE forecasts in TradingView
. . . . . Please show your support back,
. . . . . . . . Hit the 👍 LIKE button,
. . . . . . . . . . . Drop some feedback below in the comment!
❤️ Your Support is very much 🙏 appreciated!❤️
💎 Want us to help you become a better Stock trader?
Now, It's your turn!
Be sure to leave a comment let us know how do you see this opportunity and forecast.
Flat on Eli Lilly. LLYWe are not in the business of getting every prediction right, no one ever does and that is not the aim of the game. The Fibonacci targets are highlighted in purple with invalidation in red. Fibonacci goals, it is prudent to suggest, are nothing more than mere fractally evident and therefore statistically likely levels that the market will go to. Having said that, the market will always do what it wants and always has a mind of its own. Therefore, none of this is financial advice, so do your own research and rely only on your own analysis. Trading is a true one man sport. Good luck out there and stay safe!

LLY Long Opportunity LLY has provided a nice long opportunity with the recent break above the major trendline
This breakout is comparable to a previous point, which led to a large megaphone price structure
Price will likely stay above the trendline and climb within the megaphone (attempted to roughly sketch what it would look like)


LLY - STOCKS - 21. OCT. 2021Welcome to our Weekly V2-Trade Setup ( LLY ) !
-
4 HOUR
Small pullback towards previous sr level.
DAILY
Expecting more bullish pa!
WEEKLY
Overall great market structure.
-
STOCK SETUP
BUY LLY
ENTRY LEVEL @ 241.21
SL @ 231.90
TP @ Open
Max Risk: 0.5% - 1%!
(Remember to add a few pips to all levels - different Brokers!)
Leave us a comment or like to keep our content for free and alive.
Have a great week everyone!
ALAN

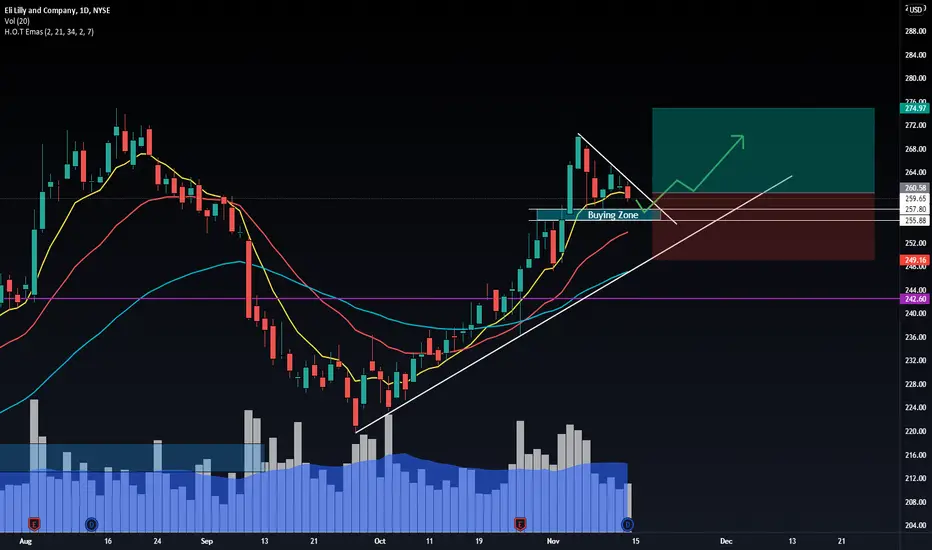
LLY trianglePulling back towards a potential buying zone ( 257.80 - 255.85)
Below that area we have a trendline that could also offer support.
Will wait for either a rejection off the buying zone or a break of the triangle
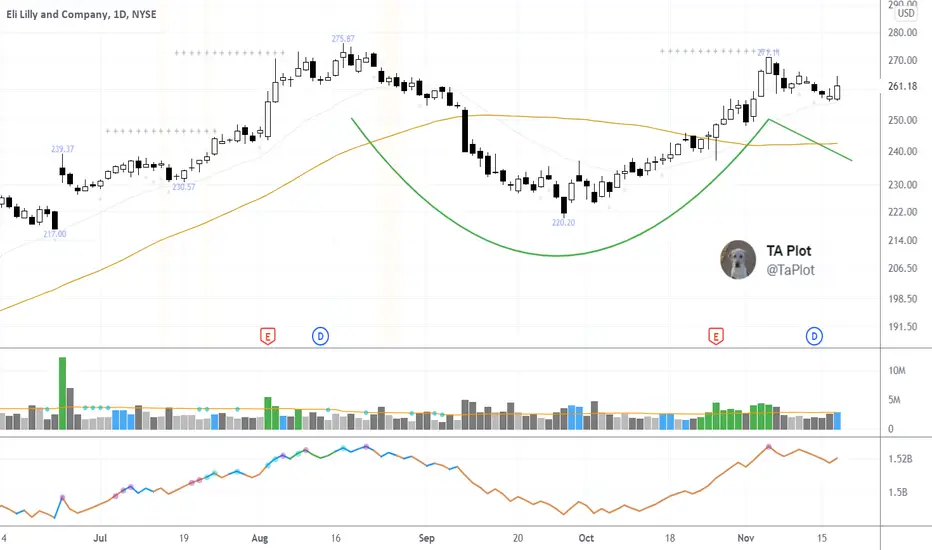
$LLY 3 Months Cup with Handle Setup$LLY also being added to the watch list. putting in a 3 month cup with handle after an impressive uptrend.
Strong demand coming up the right hand side of the cup.
LLY - Weekly Chart BoDWeekly chart shows second Buy on Dip signal near Resistance turned Support Zone and uptrend line at 220
Current price to support is around 12% (i.e 12% risk if to place your SL at below 220)
Strong and nice uptrend
FiFT Turned +ve
under Healthcare Tecnology Sector.
Earnings on 26 Oct BMO
ROE 102%, EPS this y 37%
Gross Margin 74%
Analyst target 270
Risk Reward Ratio pretty attractive but i would prefer to wait after Earnings.

$LLY Bullish Pennant, Unusual Options Activity$LLY Bullish Pennant, Unusual Options Activity
$360M of January'22 deep in-the-money calls bought today (8-9x open interest)
On watch for a daily close outside the pennant (topside).
Near term target: $300-$310 range possible by early December
Note: This is NOT investment advice.

LLY moving to the top of this range.Just like my last post this is highlighting LLY moving up. Just with arrows this time lol
