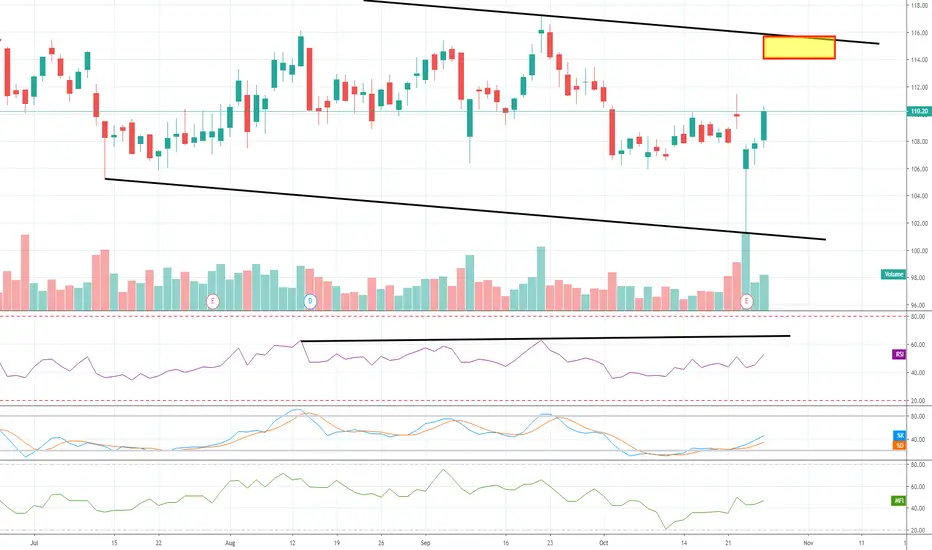
$LLY Nice bullish setup for short term target 115 Long doji green candle at bottom supported by 2 days run up targeting 115 .. for long term LLY intend to decline
LLY trade ideas
ELI LILLY and Company -LLY- Long - Bulissh Divergence and TailBullish divergence on the weekly and on the daily I see a missing right shoulder bullish divergence.
After this strong price recejection, I expect a move up at least to this projected target zone. From there on, it could move up even more, but the trade is here to find a nice exit and perhaps reenter, or partially stay in this trade.
If the reversal looks real solid, I might stay in the trade and setup a trailing stoploss.
Entry will be around 110, but I first will see how the market opens on monday.
Entry: 110.20
Exit: 117-120
SL: 105
R/R: 1:1,4 up to 1:2,0


LLY: Earnings Play. Current wave iv retracement is at Fib 38.2% which is typical for waves iv. A great ER could cause a gap and go. LLY is currently is a steeper meltup channel. A good ER will continue the meltup. A bad ER could cause a gap down to the lower channel and the Fibn 50% level. A horrible ER can cause it to drop far enough to meet the HnS target of $91 and the Fib 61.8 level

lly fails at 200nice spot to get short against on back test of 200 here, staying patient as we could grind for a few days, but if the 50 crosses 200 strong short op


holding supportbroke through down trend and held horizontal support, looks like it wants to test higher near term , either 123, or backtest of up trend.


LLY: Two peaks sell signal I think the stock has finished the 5th Elliott wave on the daily chart as there is an AO indicator divergence and Bill Williams` trading signal "Two peaks" for sell. Going short using levels that are marked on the chart.

LLY IDEA Lots of signs saying bullish IMO. I would like to see how the market opens up before entering. The bullish engulfment under the 20 day moving average is a good sign. Looking back a few weeks you can see strong resistance when the 20 day hits the 50 day moving average. This may be a time to buy at a slight discount. I thik I would like to see a nice buy candle as confirmation this next week. Good luck out there!

What goes up... I think LLY is ready for a short term pullback. It's just about as high as it's ever been.
It missed earnings estimates
Recent news includes selling a half-priced version of insulan. Great news I suppose and it did not push the stock higher. So the energy behind this stock maybe is at it's peak.
Trading today well above it's 21, 50, 200 MAs
RSI(14) is 71
Other Stuff:
The "consensus" price target (on the nasdaq website) is 123...
There are 7 "analyst firms making recommendations". 7 are strong buy and 6 are hold. I guess one of the 6 "hold" recommendations could be upgraded, which would probably send the stock up... but there's no adjustment up from Strong Buy so at least half of that is covered.
It missed earnings forecast by just a little bit in early Feb.
Fwiw Implied volatility is 25%
I googled "charts to tell me when a run has peaked" and it kinda blew my mind.
Possible study targets:
Head and Shoulders
Triple top
The problem is... at every top, it goes a little higher. Yeesh.
My bet: April 18 130/125 Put Spread for $2.50
Max profit ($250) if the underlying is below 125 on April 18.

illy a la baja-LLY está en una zona aparentemente de sobrecompra fuerte, con un volumen fuerte de ventas tras sobrepasar los 125,30 y sobrepasar una línea de canal inferior de una tendencia pasada de hace aproximadamente unos 4 o 5 años, podríamos estar ante una zona objetivo de salidas de inversores que apostaron a 5-10 años vista saliendo con rendimientos 72-160%, un precio de confirmación bajista sería cerrar por debajo de los 125 y verlo acompañado de un volumen considerado. Es altamente probable que el precio necesite visitar una zona de compra o una media móvil larga que lo equilibre, ya que es el exceso de la oferta hará caer el precio mínimo hacia el rango 116-120 encontrando una zona de compra débil, desde mi punto de vista, que es muy probable que en estos niveles veamos leves correcciones para continuar su caída a una zona de compra más fuerte hasta el nivel 104-109, aunque el primer soporte no haya sido una zona de fuerte volumen si ha sido una zona en el que los compradores pararon caídas del 8% cerrando operaciones cortas, por lo cual podría ser una zona objetivo para los bajistas y entre la zona 1 y la 2 será una zona de cierre de operaciones y de declive de la demanda. También mencionar que el rsi muestra una clara divergencia en el precio desde hace 6-7 meses. Una línea de tendencia chartista de mínimos en el rvi muestra una rotura, que puede ser un aviso anticipado del final de la tendencia.
-Entrar en 125 tras tener un cierre por debajo de ese nivel nos daría una operación de riesgo 4.2% y potenciales beneficios de 4.2%-6% y 12%-16% en un tiempo de 2 a 7 dias en el primer caso, y de 12 a 30 dias en el segundo. es cierto que podría alargarse hasta los dos meses.
Por otro lado es probable que el aumento de este volumen indique el ultimo tramo final alcista, pudiendo alcanza los 133-140 antes de comenzar el descenso, llegando al objetivo final de los inversores. En este caso no debería romper los 125 hasta alcanzar un nuevo máximo de salida confirmada. Obviamente esto alargaría el momento de entrada bajista que podría tardar varios meses, pero aumentaría la rentabilidad potencial del precio.
Esta operación sería distinta a la anterior, la zona de entrada bajista estaría sobre los 135-138 y nuestro stop loss se situaría sobre los 143-145.En este caso tendríamos 3 zonas de compras que alcanzar: la primera en el rango 124-130 con una rentabilidad de 4-8%, la segunda 116-120 con una rentabilidad del 12-14% y la tercera sobre los 104-110 con una rentabilidad del 19-23%. Esta operación completa buscando hasta la tercera zona podría tardar unos 2 - 6 meses aproximadamente en completarse.


Weekly viewPlenty of upside in this, with all recent activity, not sure if it's just ELAN share swap or something more, buying some lottos and long term LEAPs


TJX: Long opportunityAn intraday high potential, Back Tested Long Analysis.
We ll try to enter into the correction of the uptrend movement.
DETAILS ON THE CHART
NOTE: Entry range area above the entry point, is calculated upon 80% of the recorded pullback back tested past performances
DISCLAIMER: This is a technical analysis study, not an advice or recommendation to invest money on.


LLY: Long term T@M analysis$LLY is breaking out into new all time highs, on high relative volume in the daily chart, coming out of a strong daily and weekly trend, whilst also having quarterly and yearly trend signals as well. We can probably look for long entries on different kinds of technical entries here, so I'd reccomend having this stock in your watchlist.
Best of luck,
Ivan Labrie.

Eli Lilly, Bear Divergence and a Repeat Head & Shoulders PatternEli Lilly Oversold on the Monthly RSI.
RSI and MacD are both indicating bearish divergence.
Repeat on Head & Shoulders Pattern
Stock trading at 50x of earnings (forward P/E is 20), PEG ratio of 3.50! Price is 9x book value.
High Risk to Reward Ratio
3.8 to 1 with a large stop of $5.50
6:1 or better with a stop above the swing high
Target 1: $96
Target 2: $90
You could open a short now with a 5.5% stop loss, or you could wait for the H&S to complete itself.
