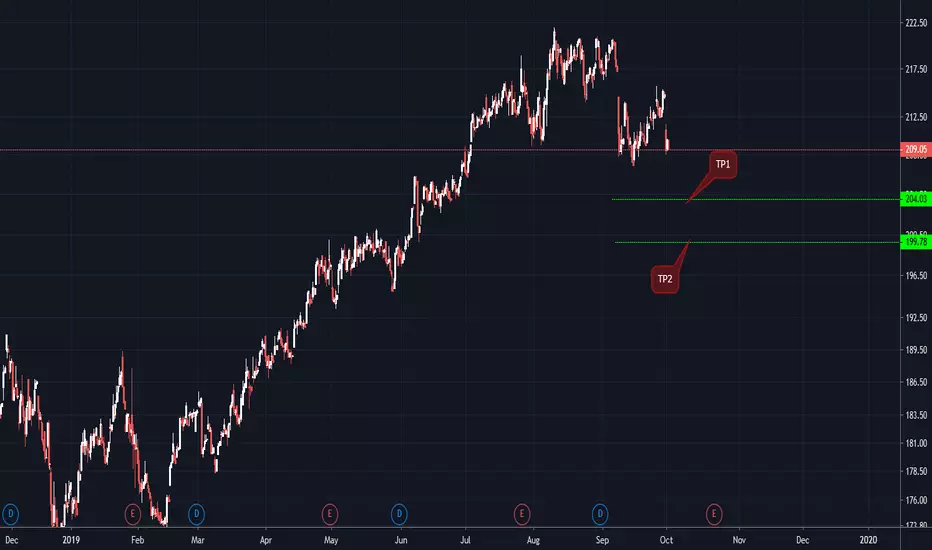
A primer on Key Earnings SupportIn this chart I'm illustrating a few trading setups that took place in $MCD following each earnings report for a year. The indicators you see in the chart are 'Average True Range' and 'Earnings Price Support' from @timwest's 'Key Hidden Levels' indicator pack.
Every time a company reports earnings, analysts, investors, portfolio managers, traders, you name it...are paying close attention on the data that comes out, and the prices that the stock is trading for at all times, this normally starts one or several days before the report, and lasts for a day or a couple days after the report. The indicator my mentor devised plots a technical level that helps us map how far prices can move, and where to seek low risk trading opportunities on subsequent retests of past reports' levels.
I use the ATR indicator to define the size of the stop losses that I use, which in turns helps me know how many shares to buy or sell when trading with this tool. To use this you need a method to determine the main trend direction, which can be fundamental or technical, or a combination of both. Time@Mode is the one @timwest created, and the one I use, which together with the proprietary indicators from the 'Key Hidden Levels' suite helps me find low risk trades that have a very good batting average.
Hope you found this post helpful, and if you did, check out my site here: www.fb.me
I offer trading signals since 2015, covering all markets I trade, or focusing only on specific markets according to each client's needs.
Cheers,
Ivan Labrie.
MCD trade ideas

1-Hour and 15-Minute Chart Suggest a Strong Resistance Area.1-Hour Chart (left) shows Fibonacci Resistance from September 12th HIGH to October 28 LOW.
The 23.6% area of the fib is right at $198 and change.
The 15-Minute Chart has Fibonacci Retracement from the openning of the earning day drop HIGH of October 22 to the LOW of October 28.
The current resistance area is right where we are right now - at upper $196.
While the next resistance area of the 38.2% is at $198 --> Which aligns with what we see in the 1-Hour Fib Retracement.
Next the RSI and MACD for the 15-minute chart suggest an overbought state, where we can drop from, or consolidate sideways.
However, the RSI and MACD on the 1-Hour chart still has some breathing space.
Therefore, I wont be surprised if we actually will reach the $198 mark.
Also, adding to this the Options speculations. If you would stack up the November 1st expiration CALLS ans PUTS - the $198 through $202 has strong acceptance window.
In addition, the MAs on the 15-minute chart have crossed over - TWICE. Waiting for the 20 MA to cross over the 150 and 200.
Bottom line, i see further upside, or at worst sideways consolidation.


MCD 1-Hour analysis to combine with the Daily ChartOn a closer look at the 1-hour chart, we can see that 7-day RSI is already moving up, MACD is just being stupid - cannot make heads or tails out of it.
Both indicators are lagging indicators, but could use to confirm a trend.
OBV flattened at the bottom, and I can only hope for some volume pickup.
If it breaks the $193.16 (1-Day resistance area) then next stop will be $198.64 - this comes from the Fibonacci Retracement from April 2019 until August 2019 (Low to High).

Daily Chart on MCD suggests a The $193.16 is a strong resistance area, as it is the Fibonacci 78.6% from August 2015 LOW to August 2019 HIGH.
If SPY remains strong today it will definitely will help MCD keep on trying to break upwards.
7-Day RSI is at 19, being oversold.
MACD curling up.
Both are lagging indicators, and have not confirmed any trend yet.
But, if we combine the 1-Day chart analysis with the 1-hour chart (and a shorter Fibonacci Retracement period), we can see that if we break over 193.16 area, we will see 198 as the next resistance.


MCD McWaaah Burger with a side of CriesDepending on the bounce back up (if there is one) I'm feeling bearish short term


Mc Donald's (MCD)Tuesday, Oct. 22, delivered a negative surprise. McDonald's earnings inched up 0.5% to $2.11 a share, 9 cents below estimates. Revenue rose 1% to $5.43 billion. We still belive that the $300 million acquisition of AI tech company Dynamic Yield will be the driver for the growth in the next year.

Machine Generated Signals. OCT19 WK4 Wkly STOCKS | MCD & ADDYYMachine Generated Signals. OCT19 WK4 Wkly
STOCKS | MCD Short & ADDYY Long (Exp. Oct 25th)
NYSE:MCD
OTC:ADDYY

Analysis of McDonalds 23.10.2019The price is below the moving average of 20 MA and MA 200, indicating the downward trend.
MACD is below the zero level.
The oscillator Force Index is below the zero levels.
If the level of support is broken, you shall follow the recommendations below:
• Timeframe: H4
• Recommendation: Short Position
• Entry Level: Short Position 198.80
• Take Profit Level: 195.00 (380 pips)
If the price rebound from the support level, you shall follow the recommendations below:
• Timeframe: H4
• Recommendation: Long Position
• Entry Level: Long Position 202.20
• Take Profit Level: 203.00 (80 pips)
USDCHF
A possible short position in the breakdown of the level 0.9835
USDJPY
A possible short position in the breakdown of the level 108.20
EURUSD
A possible short position in the breakdown of the level 1.1110
GBPUSD
A possible short position in the breakdown of the level 1.2830

MCD forming Descending Triangle The descending triangle pattern could provide further potential for MCD to go lower. Consider short trade if price closed below the descending triangle pattern. The potential downward move will be likely around $15 if price break below the descending triangle pattern.

Right Back Up To 220.00 "IF""If" MCD beats estimates then right back up it goes, so don't hesitate to jump in quick on a good earnings call. MCD has a Zacks Rank #4 (Sell) and an Earnings ESP of -0.48%, so if we get a surprise there will be a pile on.

McDONALDS 1D BULLISH WEDGEWedges are repeatable trading chart patterns.
Wedges are a form of Triangle chart pattern and will have a specific directional breakout bias.
A descending wedge has a bullish long breakout bias.
Each chart pattern will have defining trendlines of the support/resistance levels creating the pattern.
What ever time frame you are trading this chart pattern, wait for a candle close outside of the trendline in the direction of the breakout candle. (Our time frame preference is the Daily chart).
Add volume indicator - Volume is the amount of $ that went into a particular candle or in Forex the # of trades that took place.
Add ATR indicator - Volatility is the amount of price movement that occurred. Use the ATR to measure the price movement.
When you see descending Volume bars and descending ATR line (which indicates volatility) this shows
a dis-interest in traders to invest in this pair creating consolidation which creates the chart pattern.
Trade Management after there is a breakout candle close.
1 - Position size (compare volume bar to volume ma line).
a - Breakout candle must be 100% of average volume for a full position size.
b - If 75% of average volume then ½ position size. (To find 75% of Volume
look at the charts volume settings – divide smaller # into larger # = 75%+)
2 - Enter two trades.
3 - SL for both trades will be 1.5 x ATR.
4 - 1st trade TP will be 1 x ATR.
5 - No TP on 2nd trade – letting profit run and adjusting SL to follow price.
6 - When 1st TP hit – move 2nd trade SL to breakeven.
7 - Adjust the 2nd trade SL to follow price.
*8 – After Breakout candle – if price closes back into chart pattern close trade
*9 - When breakout candle is more than 1 ATR from breakout candle open.
a - Enter 1st trade at candle close with ½ position size.
b - Enter 2nd trade with a pending limit order that is 1 ATR of breakout candle open.
c – Price should pullback to that pending limit order for 2nd trade.
d – If Price returns back into chart pattern close trade before SL is hit.

10/21/2019 - $MCD Iron Butterfly PlayBTO $MCD Iron Butterfly ibb.co - $475/contract credit.
The goal is to buy this back at $100 or less one hour into the open tomorrow. Provided that $MCD stays within the 202 - 217 range, this will pay off after the IV crush and theta decay have played out.


MCD Buy When Reaches SupportMcDonalds has been showing a downtrend. McDonalds also releases its third quarter earnings report on October 22. It is likely that they will beat earnings expectations, so when it reaches the support line I would buy given the possible growth in the next week.

MCD sails through GFCIf the Global Financial System is in crisis, take a look at this winner from the GFC.

MCD Loses Its All-Time HighAfter running up due to corporation Buybacks, MCD has failed to hold those new highs as heavier than normal Dark Pool Quiet Rotation™ to lower inventory of shares continues. The stock is now stepping down in a short-term topping formation.

