META - Another great earnings, allowing us to collect value?Hi guys ,we would be looking into our analysis for META stock.
Meta Platforms Inc. has demonstrated robust financial performance, underscoring its strategic investments in artificial intelligence (AI) and digital advertising.
Strong Financial Performance
In Q4 2024, Meta reported revenue of $48.39 billion, marking a 21% increase year-over-year. Net income surged by 49% to $20.84 billion, with diluted earnings per share (EPS) rising 50% to $8.02. The company's operating margin improved to 48%, up from 41% the previous year, reflecting enhanced operational efficiency.
AI-Driven Advertising Growth
Meta's advancements in AI have significantly bolstered its advertising capabilities. In Q3 2024, advertising revenue grew by 18.6% year-over-year, reaching $39.89 billion. The integration of AI technologies has enhanced ad targeting and delivery, contributing to this growth.
Our Confidence
Overall analysis maintains a bullish outlook on Meta's stock, with an average price target of approximately $634, suggesting a potential upside of around 17% from current levels. The company's strategic focus on AI and its strong financial results support this positive sentiment.
In summary, Meta's strong earnings report, driven by AI advancements and advertising growth, positions the company favorably for continued success in the evolving digital landscape.
📌 Trade Plan
📈 Entry: 550
✅ Target: 630 - below the ATH to give an achievable destination
❌ SL: 480 - below the support zone to protect the trade
METAD trade ideas

Meta Bull Rally Not OverBullish trend line still intact, meta ready to rocket ship up, predicted move above 670-740

"MASTER OF SOCIAL REALMS, META" How Does Meta Make Money?The long-term outlook for META stock looks pretty promising. Thanks to heavy investments in AI and the metaverse, along with steady growth in its advertising business, analysts predict the stock price could climb from its current level (around $640) to anywhere between $700 and even $2,000 by 2030. AI-driven improvements in ad efficiency and growing user engagement on platforms like Facebook and Instagram are major drivers. Plus, the company’s solid financials give it plenty of room to keep investing in the future.
That said, there are risks to watch out for, like tougher regulations in Europe, increasing competition, and uncertainty around the metaverse’s success. Overall, though, META’s strong position in tech and the market makes it a solid pick for long-term investors. Just make sure to weigh those risks before jumping in.

Going to mid 500 the signs are there Getting stronger of the bearish sentiment as i closes on 700 for the second time, with OB OSC. technical indicators slowing, could take some time and could get choppy but learning it's happening.
META PUTS IN THE MORNINGHere is META currently rejecting the supply zone around 660.60. If price returns anywhere within the RED Zone tomorrow I will entering. If it Wicks at OPEN ill be entering heavy.

META Pullback or Correction? Let’s Talk.
Back in January 2025, META printed what looked like a top… but if you zoom out and analyze the structure, you’ll notice this wasn’t a true correction — just a healthy pullback.
✅ Price never broke critical structure
✅ Buyers stepped in at the 0.5–0.618 zone
✅ Current candle strength suggests bulls still in control
This isn’t random. It’s structure. And structure tells me that META is gearing up for a potential new high — especially if we clear the Jan '25 zone around 740.
Not financial advice, just what the charts are saying 🔍📊

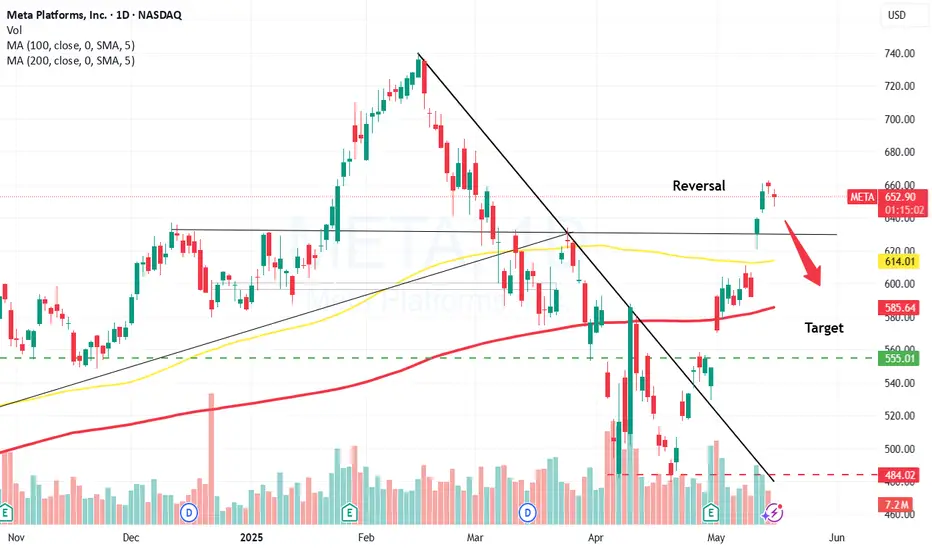
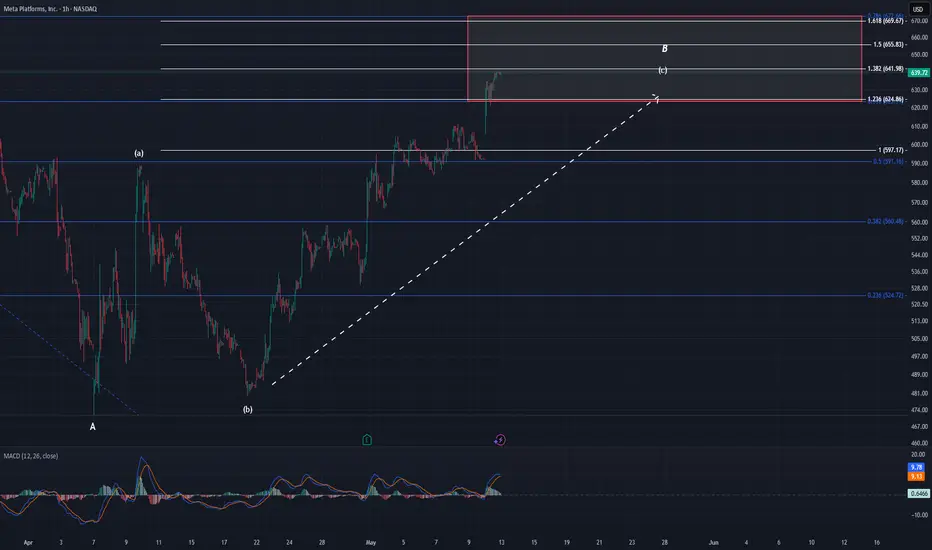
Meta UpdateNot a whole lot to add to my Meta analysis. I have been calling for this move higher for about 3 weeks now. Today we finally found out what the catalyst was to spark the move higher. As I have said multiple times in the past, I don't really care so much about the why. The thing I care about is the where. Where will price go?
Price came just shy of the 1.382 today and has enough waves in place to be considered complete. It also has created bearish divergence on MACD. These things don't mean a top is in by any means. They point to a top being in the works. I'm sure me saying this on the day META jumps almost $50 and 8% doesn't sit the best with some. To those people, I say, good luck. As always, you should trade your own convictions. Just remember, when price begins to head lower in the days / weeks to come, you heard it from me first.
Meta Platforms (META) 4H Outlook – May 2025Following a liquidity sweep and several confirmed Breaks of Structure (BoS), META has shown a bullish market shift. Price is currently hovering near $592.49 after a strong rally.
There is a clearly defined demand zone around the $555–$570 area (highlighted in green). If price retraces to this zone and holds, it could act as a launchpad for a continuation move toward the $636.95 target, aligned with a previous structural high and potential supply.
The setup reflects strong smart money behavior—monitor price reaction at the demand zone for bullish confirmation before engaging.

META: Exponential Scaling PI^0.1Meta Platforms, Inc. has been on a meteoric rise, recently surpassing $700, and its price action suggests a strong adherence to exponential growth patterns rather than linear trends. Traditional charting methods often fail to capture the real movement of high-growth stocks, making the Exponential Grid indicator, which applies non-linear scaling using a constant of Pi and an exponent of 0.1, a valuable tool for traders and investors. This approach highlights key exponential support and resistance levels, which the stock has consistently respected over the years. After a significant downturn in 2022, META rebounded impressively, breaking through critical resistance in the $500-$600 range, and now faces its next potential hurdle around $750-$775. The exponential scaling framework helps to identify price zones where reactions are likely, offering better risk-reward assessments, improved stop-loss placements, and more accurate price targets compared to linear scaling. As META continues its parabolic ascent, the next move depends on whether it can sustain momentum above exponential resistance, potentially pushing it into uncharted territory, or whether a pullback to lower exponential supports occurs. With technology stocks often following logarithmic or exponential growth curves, tools like the Exponential Grid are becoming essential for trading dynamic and volatile markets effectively. Understanding these patterns is not just a technical advantage but a crucial edge in navigating today’s ever-evolving stock market landscape.

meta upward trendline break comparison side by sidemeta has 2 identical trendline breaks side by side on the hourly (and 4 hour chart). very good to compare and contrast. both have double tops at resistance but one of the differences is that the successful break (on the left) had price under the 9 and 21 EMAs while the unsuccessful one (to the right) didnt, within many other differences.

Meta - can buy or not ?Looking from weekly chart, we are up 2 weeks consecutively!
A nice ABCD pattern has been completed and price is now consolidating at the resistance level of 602.66. Note there is a small gap up on 30 Apr.
How will price moves from here ?
1. It moves down to close the gap and then continue the run up
2. It breaks above the resistance level and run up
You can park 5% at option 1 as it is difficult to know in short term how the price action will move.
Then, if the price goes to option 2, you can add more, ie 10-15% .
Both options are on the basis you bought into the fundamentals and growth story of this company. If you are trading for short term, then it is a different story. Price has already rebounded 50+% from the bottom, meaning you probably have missed the boat to go LONG around 480-520 price level.
It also depends how long you want to hold this stock for , is it a day , a week or months? The longer your time frame, the lesser precise you need to be in your entry. Don't lose sleep if you did not catch it at the ultra bottom, very few can (they are more lucky than skilful )
As usual, this is not financial advice and please DYODD


Meta - The Correction Is Officially Over!Meta ( NASDAQ:META ) is retesting the previous all time high:
Click chart above to see the detailed analysis👆🏻
For more than 7 years, Meta has been perfectly trading in a reverse triangle formation. And just three months ago, Meta once again retested the upper resistance trendline and reversed towards the downside. But with the retest of the previous all time high, this correction is over.
Levels to watch: $500, $800
Keep your long term vision,
Philip (BasicTrading)

META (Facebook) | Long Setup | Strong Earnings | (May 2025)META (Facebook) | Long Setup | Strong Earnings & Growth Outlook | (May 2025)
1️⃣ Insight Summary
META has been in a correction since February, coinciding with macro shifts like Trump’s re-election. However, recent earnings and long-term financial projections point to renewed strength.
2️⃣ Trade Parameters
Bias: Long
Entry Zone: Around $550
Stop Loss: $476
TP1: $625
TP2: $680
TP3: $739
Final Target (Stretch Goal): $905
Partial Exits: TP1 and TP2 will secure gains early, while the rest rides momentum toward higher levels.
3️⃣ Key Notes
📈 META reported strong earnings recently, and forward guidance through 2028 looks bullish—both EPS and revenue are projected to rise.
💡 Financially, it’s solid:
• Revenue: $165B
• Net Income: $62B
• Free Cash Flow: $50B
• Debt: ~$50B
• Beta: 0.32 (less volatile than the market)
✅ Healthy cash flow and growth outlook make META attractive long-term.
📊 Technically, we're at a resistance area, and the setup aligns with broader S&P 500 structure. Waiting for a clean confirmation around $550 will be key.
4️⃣ Follow-up Note
Watching closely for a breakout above resistance or potential retest of the $550 zone for entry. Will update the idea if price structure changes significantly.
Please LIKE 👍, FOLLOW ✅, SHARE 🙌 and COMMENT ✍ if you enjoy this idea! Also share your ideas and charts in the comments section below! This is the best way to keep it relevant, support us, keep the content here free and allow the idea to reach as many people as possible.
Disclaimer: This is not financial advice. Always conduct your own research. This content may include enhancements made using AI.

This is a fragile recovery within a technically damaged chartMeta Platforms Inc. (META) — Technical Analysis
Timeframe: 1-Hour
Current Price: $546.45
Trend Bias: Intermediate-term Bearish, Short-term Reversal Attempt
Price Action & Structure
Downtrend from March to mid-April:
META has been in a clear and sustained downtrend, characterized by lower highs and lower lows. Price consistently failed to break above prior resistance levels, confirming seller dominance.
Capitulation & Bounce (mid-April):
The sell-off intensified into mid-April, where META appears to have formed a temporary bottom around $485–$490, aligning closely with a support zone (marked by the red line at $479.76).
Recent Recovery:
The stock has since shown signs of short-term strength, bouncing approximately 12% off the April lows. However, this move currently resembles a bear market rally rather than a true trend reversal.
Key Levels
Resistance:
$582.60 (Pre) – Historical pivot level; potential rejection zone.
$613.73 – Structural resistance and supply zone. Confluence with prior breakdown point.
$641.63 – $657.80 – Major resistance range. Represents previous distribution zone and failed breakout area.
Support:
$546.00 (Current level) – Price is hovering just above minor structure but remains vulnerable.
$479.76 – Last-ditch structural support; breakdown below opens risk to lower $400s.
Volume spike near the “E” suggests earnings reaction was a key turning point — important to monitor how price holds above this level.
Volume & Momentum
Volume Profile:
Increased volume at the recent low suggests capitulation or accumulation. This could mark the early stage of a base, but it’s too soon to confirm.
Momentum Indicators (Not visible here but assumed):
Typically, RSI/MACD would now be recovering from oversold. However, given the context, momentum is likely neutral-to-slightly-bullish but fragile.
Technical Outlook
Short-term:
META is attempting to recover within a broader downtrend. Watch for price action around $560–$582. If it rejects and turns lower, that would confirm the bear flag or rising wedge pattern.
Medium-term:
The stock must reclaim and hold above $582.60 to gain serious traction. Otherwise, this bounce may serve as a dead cat rally before another leg down.
Long-term Investors:
Wait for either:
A successful breakout above $613.73 with strong volume and follow-through, or
A flush toward $479.76 followed by a clear reversal pattern (e.g., double bottom, bullish engulfing).
Analyst’s Summary
This is a fragile recovery within a technically damaged chart. META must prove this bounce is real by retesting and holding higher levels. Otherwise, sellers remain in control. Patience and discipline are key here.

META Looks Ready to Explode — Breakout?Here’s my thought process going into META this week — trying to explain it simply like how I’d talk through a chart in a livestream.
Starting from the Daily timeframe, META just broke above that stubborn trendline that’s been pressing down on price since February. After earnings, price held strong — no gap down, no heavy selloff — and the candles we’ve seen since look more like a coil-up rather than a breakdown. MACD and Stoch RSI are both curling up with strength. This tells me bulls aren’t just in control — they’re charging with momentum on their side.
Now dropping to the 1-hour chart, we can clearly see how META exploded out of the recent chop range. The rally came with heavy volume, and we’re now sitting at the 582 zone — right below the GEX heavy resistance wall near 590–600. That’s the next big fight. But what’s interesting is that dips are getting bought fast — higher lows are forming and even intra-hour candles are trending clean above 9 EMA.
GEX analysis (Options flow sentiment):
From the GEX chart, there’s a clear cluster of positive call pressure above 580, and the highest net positive exposure is around 600 — that’s likely the magnet if we keep trending. On the flip side, the PUT support is far lower around 500, meaning dealers aren’t heavily hedged for downside, which typically allows more breathing room to the upside.
Also worth noting: IVR sits at 46.6 with IVX dropping slightly — suggesting option premiums haven’t fully caught up to this breakout. That’s bullish for long calls, and maybe even a short put spread strategy if we continue holding above 575.
How I’m trading this:
If META confirms above 585 with momentum, I’m eyeing a potential push toward 590 → 600 this week. If we consolidate here and fail to push through, I’ll watch 570–575 as support for a pullback buy.
Option setup idea
* Long Calls targeting 600 (preferably 2–3 weeks out)
* Or Bull Put Spread using 575/570 strikes if it retests support and holds
Final thought:
With Trump reportedly meeting with investors this week, big tech sentiment could get a macro jolt. META is already showing technical leadership — if the news cycle gets supportive, this breakout might run faster than expected.
Disclaimer: This is for educational purposes only, not financial advice. Always manage your own risk and confirm your setups.

The downfall of METAMETA
Current Price: $465.20
1-Month Move: +4.8% (from $443.90)
1-Year Move: +35.7% (from $342.80)
Year High/Low: $527.30/$328.50
Technicals:
RSI: ~67.4 (nearing overbought)
Above 20-day MA, slightly below 50-day MA, above 200-day MA (short-term rally in a longer uptrend)
Options Data:
IV Rank: 85th percentile (high premiums)
Put/Call Ratio: 1.15 (bearish skew)
Max Pain: $450.00
High OI: $460 puts, $470 calls
Historical & Model Insights
Historical Move: META averages ~14.5% post-earnings, with 5/12 quarters showing downside.
IV Crush: Expect 30–40% IV drop post-earnings, so time exits carefully.
Outlier: Llama/Meta sees bullish potential from call activity and AI-driven ad growth, but bearish signals dominate.
Trade Setup
Strategy: Single-leg, naked put (bearish, defined risk)
Instrument: META
Direction: PUT
Strike: $460.00 (premium $0.72, fits $0.50–$1.00 target band)
Expiry: 2025-05-02 (first weekly post-earnings)
Entry Price: $0.72
Entry Timing: Pre-earnings close (2025-05-01)
Profit Target: $1.44 (~100% gain)
Stop Loss: $0.36 (~50% loss)
Confidence: 65%
Expected Move: ±$68.20 (~14.66%)

META Share Price Rises Cautiously Ahead of Earnings ReportMETA Share Price Rises Cautiously Ahead of Earnings Report
As shown on the Meta Platforms (META) chart, the share price rose by approximately 1% yesterday. This movement was supported by the announcement of the launch of the Meta AI app—an artificial intelligence-based application that will function as a personal assistant on mobile phones (similar to Google Gemini).
In a different market environment, the news might have prompted a more positive reaction. However, traders currently appear to be exercising caution, as Meta Platforms (META) is due to report its quarterly results after the close of the main trading session today. According to media reports, expectations include:
→ Revenue in the range of $41.35–$41.5 billion, which implies a year-on-year increase of roughly 13–14%.
→ Earnings per share (EPS) between $5.22 and $5.29, indicating a 11–12% rise compared to the same period last year.
Key Factors in Meta’s Quarterly Report
The following areas are likely to have a significant impact on META's share price in the wake of the report:
→ Advertising business , Meta’s primary revenue stream (around 96%). There is a possibility that US tariff policies could prompt major Chinese advertisers—such as Temu—to reduce their advertising spend in the United States.
→ Investment in Artificial Intelligence (AI) and Augmented Reality . Market participants may revise their valuation of the stock downwards if there are lingering concerns over the long-term return on these investments.
→ Forward guidance on revenue and earnings for the next quarter and full year 2025. These forecasts will carry particular weight in an environment of elevated uncertainty linked to US trade policy.
Most Wall Street analysts maintain a “Buy” rating on Meta shares. However, some have lowered their price targets in April, noting that the stock has lost roughly a third of its value since its all-time high in February.
Technical Analysis of Meta Platforms (META)
Price movements earlier in 2025 continued to trace a rising trend channel (shown in blue), with a run of 19 consecutive days of gains in February following upbeat news. However, this trend channel appears to have lost relevance at this stage.
The psychological level of $500 now offers strong support, while the $585 level has turned into resistance. It is reasonable to expect that the earnings report could trigger heightened volatility and a test of one of these key price levels.
This article represents the opinion of the Companies operating under the FXOpen brand only. It is not to be construed as an offer, solicitation, or recommendation with respect to products and services provided by the Companies operating under the FXOpen brand, nor is it to be considered financial advice.

META Q1 EARNINGSMeta reports earnings today. The stock is positioned between two possible EPS outcomes. If the company reports strong results and achieves an EPS of $5, it could break through the intermediate resistance level. If the results are not favorable, the stock may retest the double bottom.

META Platforms 1H at the END of Bearish Trend Hammer SpottedMETA Platforms 1H at the END of Bearish Trend Hammer Spotted

Meta: Is the Plunge Inevitable?Despite its vast reach and market presence, Meta Platforms faces significant and compounding challenges that suggest a potentially turbulent future. While appearing dominant, the company is increasingly vulnerable to external pressures stemming from legal, regulatory, and competitive fronts. These growing headwinds threaten to erode its financial stability and alter its fundamental business model.
A critical area of concern involves the human cost of content moderation. Meta faces multiple lawsuits in Africa, alleging severe psychological harm to moderators exposed to disturbing content. These legal actions, particularly in Ghana and Kenya, argue that Meta bears responsibility for the well-being of these outsourced workers, citing inadequate support and exploitative conditions. A loss in these cases could set costly precedents, forcing Meta to significantly invest in or restructure its global content moderation operations and potentially face substantial liabilities.
Simultaneously, Meta confronts escalating regulatory action, particularly in Europe. Recent significant fines from the EU under the Digital Markets Act highlight regulatory intent to control how tech giants handle user data and maintain market dominance. These penalties, including a substantial fine over its "consent or pay" model and a previous one for unfair trading practices, signal a global trend towards stricter oversight that could constrain Meta's core advertising business model. Adding to this pressure is the ongoing US FTC antitrust trial, which seeks to unwind Meta's key acquisitions of Instagram and WhatsApp, citing anti-competitive practices. The potential forced divestiture of these highly lucrative platforms represents an existential threat, as Instagram alone accounts for a significant portion of Meta's advertising revenue.
These intertwined legal and regulatory battles, combined with intense competition in the digital landscape and the uncertain return on large investments like the Metaverse, create a challenging outlook for Meta. The cumulative effect of these pressures could significantly impact the company's profitability, market share, and public perception. Navigating this complex environment requires Meta to address these fundamental issues effectively, or face the increasing likelihood of a substantial downturn.

Meta Long price tapped weekly demand
sesoanlity is coming to pisitive in near future
underlavalued against bonds
price should break trendline on daily retest demand and off to go
Trade Safe

Meta Platforms (NASDAQ: META) Receives Analyst UpgradeMeta Platforms (NASDAQ: META) is set to report first-quarter 2025 results on April 30. Ahead of the release, the stock is trading at $532.16, down over 18% year-to-date. Concerns about a pullback in ad spending and rising AI infrastructure costs had weighed heavily on investor sentiment. However, robust engagement trends and a notably cheaper 16x EV/EBIT valuation have prompted a shift in outlook. The stock has been upgraded from Sell to Hold.
Despite macroeconomic challenges and regulatory fines from the EU, analysts maintain a positive long-term view. Benchmark’s Mark Zgutowicz cut his price target to $640 from $820 but reaffirmed a Buy rating. He highlighted Meta’s long-term strength in U.S. digital ad markets and its disciplined capital allocation.
Similarly, Stifel’s Mark Kelley reduced his target to $628, citing cautiousness in the e-commerce and subscriptions space. He acknowledged market discomfort reminiscent of the COVID-19 era.
Meanwhile, Monness’s Brian White maintained a Buy rating with a $775 target, projecting Q1 revenue of $41.73 billion and earnings of $5.54 per share. Analysts, on average, expect EPS of $5.24 and revenue of $41.3 billion, suggesting double-digit growth. The stock holds a Strong Buy consensus from Wall Street. Out of 46 analysts, 42 rate it Buy, three Hold, and one Sell. The average price target of $705 implies a potential 35.5% upside from current levels.
Technical Analysis
META has rebounded sharply off a key ascending trendline support that dates back to April 2024. The recent recovery from around $475 coincided with the ascending trendline. The price has been bullish overall, as seen from the 200-day moving average at $408.64.
Price is now about to reclaim both the 100-day ($549.11) and 50-day ($601.58) moving averages. The chart indicates a possible near-term pullback followed by a push toward the $740.91 high. Volume is currently at 44.25 million shares, suggesting rising interest.
