Introducing Don's "T R A D E - M A P" Approach: Part 3 Of 5, MOPart 3 of 5. The above chart is a 4 hour time period. The goal of this chart is to confirm, on a shorter term time basis, that the breakout uptrend in Altria Group is valid. Indeed it is. Once again, the elements of Don's "TRADE-MAP" approach are:
1. T : Time and space (Fractals); 2. R : Repeating Cycles; 3. A : Advancing Trend; 4. D : Declining Trend; 5. E : Energy in Phase Forces.
Now the letters in MAP:
6. M : Momentum and Velocity; 7. A : Analysis of Structure; 8. P : Price Performance. There you have it: Don's personal "TRADE-MAP".
One item I must mention. The ideas I present are from a lifetime of reading and listening to others. In other words, I do a lot of bench-marking. I combine what I think are the "best practices" and discipline myself to use them. The combined efforts of some really great technicians are in my work: Bill Williams, Justin Mamis, Jason Stapleton, John Murphy, John Bollinger, Charles-Dow, Robert Precther, Harold McKinley Gartley, Ralph Nelson Elliott, and others too numerous to honor. I do charting simply because I enjoy it. Yours for better trading, Don.
MOB trade ideas

Introducing Don's "T R A D E - M A P" Approach: Part 2 Of 5, MOHere are the letters and what "TRADE-MAP" means to me (first the letters in TRADE):
1. T : Time and space (Fractals); 2. R : Repeating Cycles; 3. A : Advancing Trend; 4. D : Declining Trend; 5. E : Energy in Phase Forces.
Now the letters in MAP:
6. M : Momentum and Velocity; 7. A : Analysis of Structure; 8. P : Price Performance. There you have it: Don's personal "TRADE-MAP".
When I mention "Don's Top Ten Technicals", I use the elements of the "TRADE-MAP" approach: 1. The Ichimoku Cloud is rising. 2. Prices are trading above the cloud. 3. Prices are trading above the thick red Ichimoku Cloud Conversion line. 4. The thick red conversion line is also rising. 5. The thick black line is the Ki jun-Sen baseline of the Ichimoku Cloud , which is rising and above the cloud. 6. The indicator on the top of the page is RSI / Stochastic , and this is strong. 7. The top middle indicator is vortex and it is extremely strong (green over red). 8. The Top (bar-type) indicator measures the "phase energy" of the stock, and this is strong. 9. The green fractal arrows are up. 10. Look to the far right on the chart, around $63.00. You will note a yellowish line on top (lips), with black dots below (teeth), and a blue line (jaw) below the black dots. Now, all three are rising, correct? This is where I ask you to use your imagination and envision these three items as the "widely separated jaws of a feeding alligator". This is a very positive indication because the alligator is FEEDING in the uptrend. Altria Group is RISING, and I believe it will continue to do so until the confluence of technicals tells me differently. The Fibonacci time cycles (long blue vertical lines) indicated a breakout on 10-01-15, top of first breakout run 10-25-15, end of sell down 11-18-15, continued consolidation phase 12-14-15, second breakout wave 02-03-15, and, the next time cycle is 04-18-15. The Fibonacci time cycle is giving me a clue that this is an important date. Please move to Part 3 of this series, the 4 hour chart for MO. I hope my "TRADE-MAP" approach has been entertaining and informative. Yours for better trading, Don.

Introducing Don's "T R A D E - M A P" Approach: Part 1 Of 5If you go on a trip to a far-away place, wouldn't you want to use a highway map? Then why would you trade financials without a "TRADE-MAP"? I would like to introduce you to Don's "TRADE-MAP". It is a set of tools that I use to formulate opportunities. Your tools can surely be different, but stick to some core indicators that work for you over time. Here are the letters and what "TRADE-MAP" means to me (first the letters in TRADE):
1. T : Time and space (Fractals); 2. R : Repeating Cycles; 3. A : Advancing Trend; 4. D : Declining Trend; 5. E : Energy in Phase Forces.
Now the letters in MAP:
6. M : Momentum and Velocity; 7. A : Analysis of Structure; 8. P : Price Performance. There you have it: Don's personal "TRADE-MAP".
For an example, let's apply the TRADE-MAP approach to MO. Here is a continued analysis of what I published three days ago: After point "D" was established, I did a Fibonacci retracement of impulse leg D to A. MO did indeed sell down to the first key area, usually Fibonacci .618. The second strength in this chart is the Ichimoku Cloud in the background. If you look left to the mid-point of the chart, the cloud is rising as it moves to the right. The cloud movement higher is bullish . So too is the upside reversal at Fibonacci .618 ($60.47). These are both indications of STRENGTH ahead in MO."
The red arrow in the upper right shows the Fibonacci extension at 1.272 (where I think MO will pause, first price target of approximately $65.06). On this chart I also used Fibonacci time cycles (long vertical blue lines). Please note that these cycle lines did indeed show me "WHEN" significant events happened in MO. The next Fibonacci time cycle is due on April 18, 2016. Does this mean MO will keep hitting new highs until this date? Will Fibonacci 1.272 ($65.06) be hit on this date? Who knows? But, I now have a clue as to WHEN something is likely to happen. It forces me to anticipate change. Now, please move to Part 2 of this five part series. I hope this has been entertaining, informative, and helpful. Yours for better trading, Don.

Up In Smoke? Weakness Vs. Strength, SPY Vs. MO, Part 3 Of 4The time cycle on the chart is 4 hours. In part 2 I said there were other indicators I used to determine the STRENGTH in MO (Altria Group). Here they are, and for fun lets call them "Don's Top Ten Technicals": 1. The Ichimoku Cloud is rising. 2. Prices are trading above the cloud. 3. Prices are trading above the thick red Ichimoku Cloud Conversion line. 4. The thick red conversion line is also rising. 5. The thick black line is the Ki jun-Sen baseline of the Ichimoku Cloud, which is rising and now above the cloud. 6. The indicator on the top of the page is RSI / Stochastic, and this is strong. 7. The top middle indicator is vortex and it is extremely strong (green over red). 8. The Top (bar-type) indicator measures the "phase energy" of the stock, and this is extremely strong. 9. The green fractal arrows are up. 10. Look to the far right on the chart, around $63.00. You will note a yellowish line on top (lips), with black dots below (teeth), and a blue line (jaw) below the black dots. Now, all three are rising, correct? This is where I ask you to use your imagination and envision these three items as the "widely separated jaws of a feeding alligator". This is a very positive indication of the uptrend. MO is making all-time highs, and I believe it will continue to do so until the confluence of technicals tells me differently. Part 4 of this series will be of SPY, and I will show you the same analysis that is on the above chart, only on the weak side. It is my intent that after you view MO and then view SPY you will be able to tell the difference between strength and weakness. I hope this has been helpful, entertaining, and informative. Yours for better trading, Don.

Up In Smoke? Weakness Vs. Strength, SPY Vs. MO, Part 2 Of 4This is the second of a four part series I am writing to help you identify potential STRENGTH in your charts, and, hopefully, make you some money. Altria Group, parent company of Phillip Morris, completed a Bearish Butterfly pattern. Unlike SPY, please note two key strengths in this chart. After the C to D impulse leg the price action in MO was lower, as it usually will be after a Bearish Butterfly pattern. After point "D" was established, I did a Fibonacci retracement of impulse leg D to A. MO did indeed sell down to the first key area, usually Fibonacci .618. The second strength in this chart is the Ichimoku Cloud in the background. If you look left to the mid-point of the chart, the cloud is the opposite of SPY, it is lower to the left and rising as it moves to the right. The cloud movement higher is bullish. So too is the upside reversal at Fibonacci .618. These are both indications of STRENGTH ahead in MO. The red arrow in the upper right shows the Fibonacci extension at 1.272 (where I think MO will pause, first price target of $65.03). Part 3 of this series is next, the chart of Altria Group (MO), the parent company of Phillip Morris (PM). I will attempt to show you other indicators for MO (demonstrating strength), and why I am bullish on the stock.


ALTRIAThis stock has shown great strength: I see a doublé bottom, a recent Harami pattern on the weekly chart and a clear support price level ($56). The risk for long positions is limited (about 2%-3%).


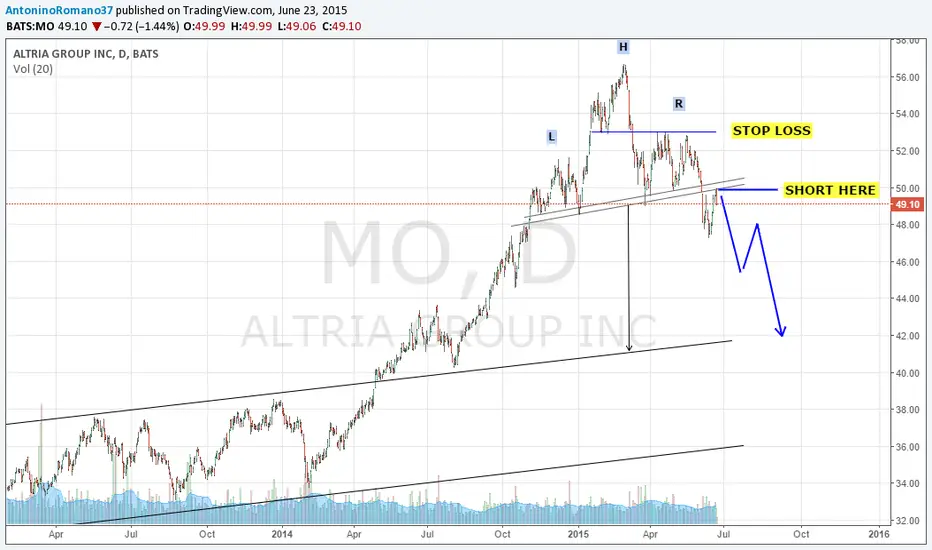
MODays ago we commented on the possibility of a pull back of MO to the $50 a level at which to open a short strategy playing the HS pattern. Today was the day to activate this strategy. The stop loss is shown on the graph as well as the expected target.
MOVery impressive HS pattern with projection below $42. If I had Altria in my portfolio I would have already sold it.

Seasonal Trade With 81.8% Win Rate Over 44 Year Period.Seasonal Trade With 81.8% Win Rate Over 44 Year Period.
Provided By Jake & Elliott Bernstein www.2Chimps.net
On Wednesday Jake will share a Seasonal Trade with a 84.8% Win Rate.
Jake Bernstein will be a contributor on TradingView when Bactesting/Strategies are released. Jake is one of the Top Trading System Developers in the world with 45+ years experience and he is going to teach how to create Trading Systems and how to Optimize the correct way.
This is an Example of a Seasonal Trades Package that Jake will be releasing on TradingView.com
Symbol: MO
Dates:
Buy on Close 4/13/2015
Sell On Close 4/30/2015
Stop = 12%
Statistics:
P/L Ratio = 5.5
# Years = 44
Wins = 36
Losses = 8
% Wins 81.8
% Avg Profit = 13.37%
% Avg Loss = 11.65

POSSIBLE MO SHORTI am not going to elaborate on this one , most of the commentary is plotted all over the chart. I am rather hesitant to take the "ride" down, the target is not so obvious.( 52.00 may be it. ) But if You need to trade this one , placing a safe stop at 55.50 is highly recommended.

Strong dollar and 5 year high, MO looks good to short here.With the strong dollar affecting foreign profits, and other cigarette companies showing lower profits, plus the continued negative sentiment towards the industry, this retest of the high is a good place to go short.

Looks good for a short position.It seems that the choice of direction is made. Low volatility reduces risk and provides an opportunity to increase your bid.


