[mid-term] MSFT Price Prediction :20% profit expect MSFT Price Prediction
Welcome to this updated analysis on MSFT
Let’s get right to it!
This information is to be used for educational purposes only
TRANSPARENCY Strategy
MSFTD trade ideas

MSFT - A tapered progressionTrying my best to explain what I see - when you start to see it it will all start to make sense and you will never look at the market the same
Happy to answer any questions as always!
Happy Trading :)
- TradeDaddyOG

Billiam Yates (TGR - pt.3)I've made good profit playing MSFT calls over the past year. But now I'm seeing evidence that a major top is in, and there will be some explosive downside near/mid term.
Sell zone is 410-420 (so if it goes to 420 I'll take that as a gift to load June puts). Expecting the reversal to the downside to begin by May 10th.
Target 1 = 399 by 5/17
Target 2 = 390 by 5/31
This is setting up for further downside to 380s at least, probably a lot lower.
~Sincerely
Willy G.

Get confirmationIt seems that with risk management, you can enter a sell position with a target of $358 and a S.L of $432

MSFT - Back at it with analysis and trade opportunitiesWas away for a few weeks and surely missed out on many good opportunities. I had swing positions on a lot of things but am now back to being on the charts.
Here is analysis on MSFT which we can see signs of tapering forming and also a slight potential bullish indication through one of our algo tricks.
Happy Trading :)
- TraderDaddyOG

MSFT Bear pennant here. Looking for a move to close gap a 390 in the next 2weeks.!
Larger picture is a correction through a rising wedge (See link)..
That correction is still on going and i think Msft will retest 366 before this fall via H&S
XLK sector also at resistance here.. Overbought and set for a pullback
Stop losses set at 417
MICROSOFT MOMENTUM IS AT APEX = 0 ACCELERATION TO UPSIDEVelocity vectors defined, long squeeze imminent. Load your shorts bois, we're going down swinging ;)
Love,
dysonring2050

Last High For A Long Time Coming...Looks like we're on the last leg here of this impulsive move and we will probably top out later this year to complete our 5 waves and after that it will be a multi year bear market...maybe much longer.


A channel, inside a channel, inside another channel.The smallest channel will most likely break to the upside. Ultimately we’re going to hit the mid-point of the largest channel. Or hit the low end.

Microsoft Set to Rival Google and OpenAI On Development of MAI-1Microsoft ( NASDAQ:MSFT ) is developing a new AI language model, MAI-1, to compete with Google and OpenAI. Under the supervision of Mustafa Suleyman, former Google DeepMind co-founder, the model aims to surpass the capabilities of Google and OpenAI. MAI-1 is expected to surpass Microsoft's previous smaller, open-source models in size and capability, potentially signaling higher costs. The purpose of MAI-1 is yet to be fully determined and is contingent upon its performance.
The model's unveiling may occur during Microsoft's upcoming Build developer conference. Microsoft ( NASDAQ:MSFT ) recently introduced Phi-3-mini, a smaller AI model, aiming to broaden its client base with cost-effective alternatives. Phi-3-mini, measuring 3.8 billion parameters, is available in the Microsoft Azure AI Model Catalog, Hugging Face, Ollama, and as an NVIDIA Corporation NIM microservice with a standard API interface.
Microsoft's substantial investment in OpenAI technology and ChatGPT deployment has positioned it as a frontrunner in generative AI.

Microsoft Priced in Cameco#Microsoft which is already in a bear market, is very close to imploding, priced in #Cameco.
Guess which of the two you should favor?

MSFT May 3, 2024: An Analysis of A Previous Consolidation ZoneAt the close of May 3, 2024, this is the second week NASDAQ:MSFT touched the 30-weekly MA and bounced back.
Let’s look at a recent time when NASDAQ:MSFT was also trading around its 30-week MA for a while before resuming an uptrend. That was during September and November 2023 (an area where I use the yellow arrow to point to).
Below we will zoom in to this area and make some analysis on the daily chart.
Let’s look at the session on Oct 30, 2023, where I point to with the yellow arrow.
The second pane is the Relative Strength Line
There are a few things we can notice here
First, there is a consolidation zone forming from the beginning of October 2023 before this breakout.
Second, the consolidation zone is above the MA-20/50/150/200. Especially, the MA-20 (green) and MA-50 (blue) are very closed to each other.
Third, if you look at the period before that, from August to October, which I marked with 2 white rectangle, we can see that that short-term volatility contracted relative to the long-term volatility, indicating a contraction zone here.
Lastly, if we look at the relative strength, it goes up all the way during this consolidation, making a new high before the stock itself.
Those are the combination of many factors: a pattern, contraction zone, moving averages, relative strength, suggesting a buy point for the stock. It is not simply a support from a 30-week MA, but many other technical characteristics.
Therefore, I expect to see similar characteristics to happen now to enter this stock again, i.e.,
The relative strength should cross above its EMA-21 which is likely to happen next week if the overall market continues to act well
The MA-20 should cross above MA-50
The price should be consolidating above the MA-20 and MA-50
I will update here as I will be trading NASDAQ:MSFT in the near future.

Looking hot 🔥Let me know what you think! 🤑 Due too Microsoft delayed reaction too it's Q1 and all the good news lately. I suspect that today will close out around 420 for sure 😊

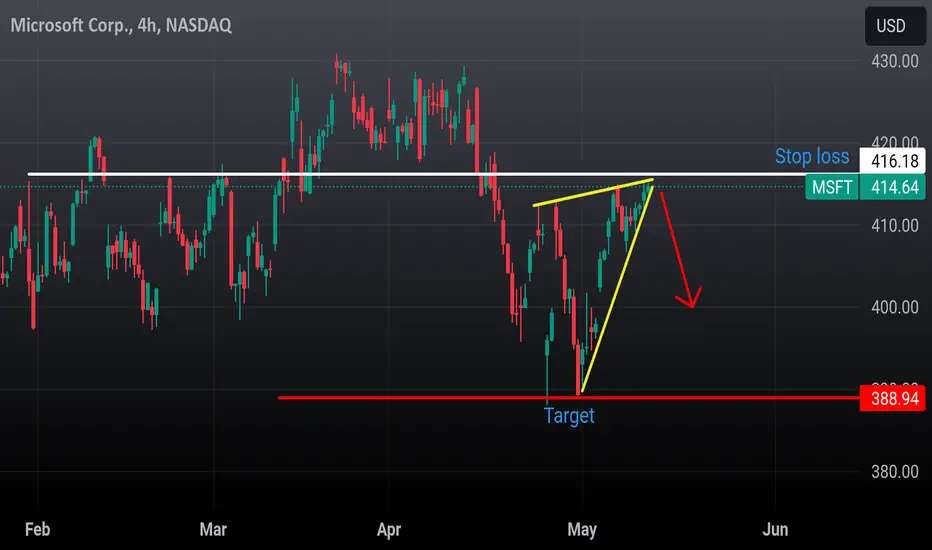
MSFT-A bearish flag continuation patternA good time to short sell MSFT as I see a bearish flag continuation pattern forming on the 4H time frame.

MSFT, big pictureWhat an amazing chart... I have wave (1) peaking in December 1999, wave (2) completing a zigzag ABC in March 2009, wave 3 ending in November 2021, wave (4) triple-three ending in November 2022, and wave (5) likely complete in March 2024. Parallel channel connecting waves (1), (2), and (3) provided (along with Fibonacci) strong support for wave (4). MSFT could go higher, but I think this is a technically-sound count for completion.

MSFT (May 1 - FOMC)MSFT can run up on a day trade to 399 to close a Daily FVG close. Or continue to fall and break past the Weekly Gap close at 388. Depending on the FOMC Press Conference we could have a volatile day in the markets.

MICROSOFT on an excellent long-term buy level.Microsoft (MSFT) has been trading within a Channel Up since the January 06 2023 low and yesterday came to the closest 1D candle closing to the bottom (Higher Lows trend-line) of the Channel Up since September 27 2023.
That was also the last Higher Low of the Channel Up, achieved exactly on the 0.382 Fibonacci retracement level from the previous Low. With the price now below the 1D MA100 (green trend-line) but still above the 1D MA200 (orange trend-line), it appears that we are on symmetrical levels with that Higher Low.
The 1D CCI patterns between the two fractals are also similar and long-term investors can start considering buying MSFT again. Our medium-term Target is $450.00.
-------------------------------------------------------------------------------
** Please LIKE 👍, FOLLOW ✅, SHARE 🙌 and COMMENT ✍ if you enjoy this idea! Also share your ideas and charts in the comments section below! This is best way to keep it relevant, support us, keep the content here free and allow the idea to reach as many people as possible. **
-------------------------------------------------------------------------------
💸💸💸💸💸💸
👇 👇 👇 👇 👇 👇


MSFT April 23, 2024: A Key SupportAs the close of April 22, 2024, NASDAQ:MSFT had the first reaction at the support area, the white line as shown on the chart, which started to form since January, 2024.
The close provides an early entry opportunity to see if the support can hold. We can put the stop loss 2% below the low of the April 22 session.
Another risk we need to pay attention to is that the quarter earnings is very near (April 25)

MSFT April 30, 2024: Entering the 30- and 52-Week MA AreaAt the close of April 30, 2024, with an ugly price action, NASDAQ:MSFT started to enter an area between 30-week MA (orange) and 52-week MA (purple) as shown in its weekly chart below
Which is equivalent to an area between 150-day MA (orange) and 200-day MA (purple) on its daily chart.
This area was also a consolidation zone between Nov 13, 2023 and Jan 8, 2024.
Let's watch closely if this area can again be a support are for this stock during this overall market correction.

MSFT likely made a long term top.Chart says it all. Multi decade parallel channel top has been reached. Now markets are sharply pulling back. Watch for break of long term uptrend red line and ideally short on retest of the red line. Possible HS pattern could play out too, back to 300$ in upcoming months

Initial Target is $370Microsoft had great earnings recently and after the announcement buyers rallied the shares...only to see that confidence 100% eroded as of today.
What are traders telling us about Microsoft?
My analysis shows a minimum target of $370 with a decent chance of seeing $343 or slightly lower in the coming weeks.
Best to all,
Chris
