MSFT Microsoft Corporation Options Ahead of EarningsIf you haven`t bought MSFT after they revealed a 49% Stake in OpenAI creator of ChatGPT:
Then analyzing the options chain and the chart patterns of MSFT Microsoft Corporation Options prior to the earnings report this week,
I would consider purchasing the 350usd strike price Calls with
an expiration date of 2023-12-15,
for a premium of approximately $6.90.
If these options prove to be profitable prior to the earnings release, I would sell at least half of them.
Looking forward to read your opinion about it.
MSFTD trade ideas

📈📊 #ChartPattern Alert! 📈📊 📈 Channel 📈A "channel," in the context of trading and technical analysis, is a chart pattern that forms when the prices of a financial asset move between two parallel lines, creating a kind of corridor or channel. There are two main types of channels: an ascending channel and a descending channel.
Ascending Channel: This channel forms when prices have an overall upward trend, but this trend is contained within two upward-sloping parallel lines. The lower level is the support, where prices often find buyers, while the upper level is the resistance, where sellers may come into play. Traders often view the ascending channel as a sign of the continuation of the existing uptrend.
Descending Channel: On the other hand, the descending channel forms when prices have a downward trend, but this trend is bounded by two downward-sloping parallel lines. The upper level is the resistance, where prices tend to retreat, while the lower level is the support, where minor bounces may occur. Traders typically interpret the descending channel as a sign of the continuation of the downtrend.
Channel analysis is an important tool for traders as it can help identify entry and exit points, as well as set profit targets and stop-loss levels. However, it's crucial to note that channels are not foolproof, and prices can break beyond the channel lines, signaling a change in trend.
In summary, a "channel" is a chart formation that depicts the direction and strength of a price trend in a financial asset. It's a useful tool for traders looking to make informed decisions about their market trades.

Microsoft Stock Surges After Revenue, Earnings BeatsMicrosoft (MSFT) announced its quarterly earnings after the closing bell on Tuesday, beating analysts' expectations on revenue and earnings per share. The tech giant reported revenue of $56.5 billion in the quarter, above consensus estimates of $54.5 billion.
Adjusted earnings per share (EPS) topped out at $2.99 compared with an anticipated $2.66 per share. The company saw adjusted EPS of $2.35 during the same quarter last year.
Shares rose more than 3% in early trading on Wednesday, after Microsoft said higher-than-expected AI consumption boosted its cloud business.
Microsoft's Intelligent Cloud segment, which includes its Azure business, brought in $24.3 billion in the quarter. Wall Street was looking for revenue of $23.6 billion. Azure and other cloud services revenue jumped 29% in the quarter, beating Wall Street's expectations of 27%.
"With copilots, we are making the age of AI real for people and businesses everywhere," Microsoft CEO Satya Nadella said in a statement. "We are rapidly infusing AI across every layer of the tech stack and for every role and business process to drive productivity gains for our customers.”
The company's Productivity & Business Processes, meanwhile, saw revenue of $18.6 billion, while More Personal Computing took in revenue of $13.7 billion versus analysts' expectations of $18.3 billion and $12.9 billion, respectively.
Microsoft has made AI a cornerstone of its business over the last year, announcing a massive $10 billion investment in ChatGPT developer OpenAI and unveiling generative AI-enhanced versions of its Bing search engine and Edge browser in February.
Since then, the company has launched various generative AI-powered Copilot apps for Outlook, Windows 11, and Microsoft 365. The software can summarize emails, help you draft documents and create PowerPoint presentations, and provide insight into Windows 11 features. Microsoft says it will combine the Copilots into a single app in the future.
The investments are meant to help spark a new growth cycle for Microsoft, as customers look to artificial intelligence as a means of streamlining certain business processes and improving employee efficiency.
In addition to its massive focus on AI capabilities, Microsoft recently closed its $69 billion acquisition of Activision Blizzard. The deal is the largest in Microsoft’s history and instantly makes it the third-largest video game company in the world by revenue behind Tencent and Sony. The Federal Trade Commission, however, could still try to break up the companies on antitrust grounds.

MSFT Earnings TodayPrice Target $350 level
Will the magnificent 7 save the day?
The earnings call today after market close will provide clarity

Microsoft earnings tomorrowMSFT Q1 September 2023 earnings are on Tuesday 10/24/23 at 4:05pm. Microsoft (MSFT) reported earnings of 2.69 per share on revenue of 56.19 billion for the fiscal fourth quarter ending June 2023. The consensus earnings estimate was 2.54 per share on revenue of 55.44 billion. The company beat expectations by 1.51% while revenue grew 8.34% on a year-over-year basis. The company said during its conference call it expects first quarter revenue of 53.8 billion to $54.8 billion.
Q1 September 2023 Consensus:
EPS = 2.65
Revenue: 54.49B
Moving averages:
VWMA 50 = 325.50
VWMA100 = 332.67
VWMA200 = 299.21
TTCATR20:
R3 = 346.13
SMA20 = 324.14
S3 = 302.15
Options data:
10/27 expiry
Put Volume Total 22,155
Call Volume Total 61,306
Put/Call Volume Ratio 0.36
Put Open Interest Total 66,229
Call Open Interest Total 81,123
Put/Call Open Interest Ratio 0.82
11/03 expiry
Put Volume Total 3,498
Call Volume Total 6,752
Put/Call Volume Ratio 0.52
Put Open Interest Total 18,034
Call Open Interest Total 41,065
Put/Call Open Interest Ratio 0.44
11/10 expiry
Put Volume Total 1,815
Call Volume Total 2,132
Put/Call Volume Ratio 0.85
Put Open Interest Total 9,979
Call Open Interest Total 8,866
Put/Call Open Interest Ratio 1.13
11/17 expiry:
Put Volume Total 7,007
Call Volume Total 12,906
Put/Call Volume Ratio 0.54
Put Open Interest Total 185,116
Call Open Interest Total 188,436
Put/Call Open Interest Ratio 0.98

MSFT range and market structureMSFT long term range on daily chart. Lower highs and a recent lower low. RSI rejected from bullish control zone twice. Earnings soon.

$MSFT Implied move for earningsNASDAQ:MSFT Implied move for earnings
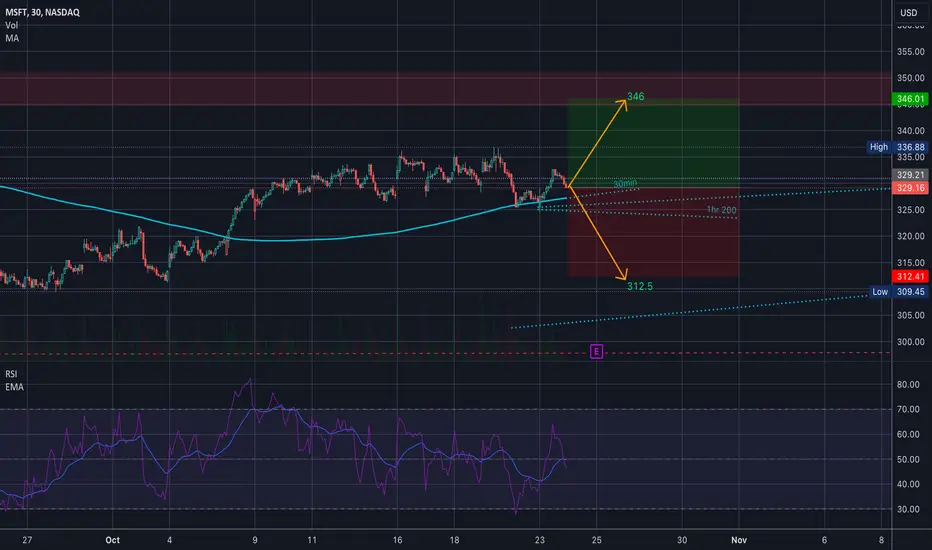
WOW… the MSFT chart is beautiful. I haven’t looked at it in a few weeks and something about it is calming to my mind…
This is not an in depth anlysis… this is just the implied move for earnings…. Which is 312.5 to 346…. and RSI is right in the middle...
But I might have to spend a little more time on this chart in the next few days….
Happy trading, y’all…
StoppingOn Friday we have risen above the MA which became the current support now. After a short downward correction we have recovered already what is confirming the support.
After today's Hanging Man we failed to test the support again.
I take this together as a bottom for a coming spike up.

MSFT#Microsoft - H1
📣 By examining the 1-hour timeframe, with a break of the support at 323.84, we can anticipate a price decline towards the 316.00 range.
⛔ Stop Loss: 328.70

Microsoft 23/10 MovePair : Microsoft Corp
Description :
Symmetrical Triangle as an Corrective Pattern in Short Time Frame , Rejecting from the Upper Trend Line and Demand Zone. Completed Impulsive Waves and Corrective Waves " abc " , If it Breaks the Lower Trend Line and Retest then it will Short
Entry Precaution :
Wait for the Proper Rejection with Strong Price Action


💵 E a r n i n g s J o u r n a l📶 S T A T I S T I C A L A N A L Y S I S
Current 50-Day Market Trend: sideways/holders/neutral.
Next Swing: neutral swing of volatility.
Next Wave: buy wave to the ceiling.
Next 50-Day Market Trend: long/buyers/positive.
Trade Type: Touch & Go don't wait for a close.
💵 E A R N I N G S A T A G L A N C E
Release Date: 10/24 AMC
Quarter: FQ1'24
_______________________________________________
Revenue Anticipations: positive surprise of Revenues.
Revenue Surprise-Confidence: on a scale of 0-9, #4
Revenue 2-Year Trend: the company trend in Revenues is positive.
_______________________________________________
EPS Anticipations: positive surprise of EPS.
EPS Surprise-Confidence: on a scale of 0-9, #5
EPS 2-Year Trend: the company trend in EPS is positive.
_______________________________________________
📝 S Y N O P S I S
🟢BUY: If the earnings report is above the Wall Street consensus, I expect the market will buy the +surprise.
⚪NEUTRAL: If the earnings report is released with complicating press, I expect the market will avoid the surprise and invest in alternative securities.
🔴SELL: If the earnings report is below the Wall Street consensus, I expect the market will sell the -surprise.
🔎 R E S E A R C H D E P T H
Technical Analysis: daily chart.
Fundamental Analysis: EPS & Revenue data.
Press/News: none.
Social Media: none.

Natural Gas Price Forecast & 7 Mega Cap Tech Stocks Forecast00:00 Natural Gas stock Bulls NatGas Support & Resistance Guide
02:34 AMEX:UNG Stock Forecast
04:04 USO Oil Stock Forecast
05:34 Gold XAUUSD Stock Forecast
06:37 US dollar DXY Stock Forecast
07:47 Silver XAGUSD forecast
09:22 QQQ Stock Price Forecast
11:28 Sp500 ETF Price Forecast
13:25 Tesla Stock TSLA Forecast Technical Analysis
14:50 Nvidia Stock NVDA Forecast Technical Analysis
17:14 Apple Stock AAPL Forecast Technical Analysis
18:00 Amazon Stock AMZN Forecast Technical Analysis
18:57 Google Stock GOOGL Forecast Technical Analysis
19:46 Microsoft Stock MSFT Forecast Technical Analysis
21:29 Meta Forecast Technical Analysis

Price Action Range Here we have a trade idea that came from a price action range. The idea is simple, we have a price action range that popped above and fell right back into the range. Also had a liquidity grab towards the downside. The target will be right under the liquidity grab. The reason being is we can expect price to go down near/pass this level because the liquidity grab used up all the liquidity at that area therefore making it easy to pass

MICROSOFT: No buying before the Resistance breaks.Microsoft made an important bullish breakout as it crossed over the LH trend-line of the Falling Wedge last week and turned bullish on the 1D technical outlook (RSI = 58.105, MACD = 2.380, ADX = 32.602). The last sell signal is near the dotted top of a potential Channel Down pattern. As long as it holds, we are taking the sell and target the 1D MA200 (TP = 313.00). On the contrary, if the price closes over the R1 level (341.00) we will go long and target the R2 level (TP = 366.50).
The fact that the 1D MA50 is holding is certainly a build up to a bullish trend potentially. As is the Bullish Cross on the 1D MACD, which by the way is on a Bullish Divergence (HL) against the LL of the stock price.
## If you like our free content follow our profile to get more daily ideas. ##
## Comments and likes are greatly appreciated. ##

MSFT Showing Strength on Retest Ahead of EarningsPercentage of Shares Held by Institutions is a bit low at 69% for NASDAQ:MSFT stock right now. However, the indicators are showing some strength as it retests the lower level of resistance above its current price.
NASDAQ:MSFT reports earnings next week on Tuesday. Microsoft has focused on AI for small businesses, the market niche that helped move it out of its 16-year slump until 2016, and during the pandemic. The pandemic anomalies in revenues should be patterned out this earnings season.
The stock has ample support at the most recent lows. It is a heavily weighted component of all 3 indexes, so an important report for Q3.

$MSFT Falling Wedge? Bullish Breakout Ahead?It looks to me that NASDAQ:MSFT is in a Falling Wedge Pattern. Often these resolve to the upside. It looks to me that NASDAQ:MSFT is testing the top of that wedge now. This may be one you want to watch. I have an alert set for a move over $332.60. If it triggers, I will look at a lower timeframe for an entry. This may have a run-up before earnings which are in about 13 days (I have not verified the date.)
Ideas, not investing / trading advice. Comments always welcome. Thanks for looking.
According to Investopedia:
Some studies suggest that a wedge pattern will breakout towards a reversal (a bullish breakout for falling wedges and a bearish breakout for rising wedges) more often than two-thirds of the time, with a falling wedge being a more reliable indicator than a rising wedge.

$MSFT - 15 min 2 steps for Bullish Scenario with T1S Indicator:
1. Candles Above the Green Line:
• Check that the candles on the chart are positioned above the green line of the T1S indicator. This could be an indication of bullish momentum.
2. Bars Above Zero:
• Ensure that the bars on the T1S indicator are above zero. This condition might suggest positive market sentiment or upward price movement.
2 steps for Bearish Scenario with T1S Indicator:
1. Candles Below the Green Line:
• Verify that the candles on the chart are positioned below the green line of the T1S indicator. This condition may indicate bearish momentum or a potential downward trend.
2. Bars Negative Below Zero:
• Confirm that the bars on the T1S indicator are in the negative territory and located below zero. This setup suggests a negative market sentiment or downward price movement

The Best place to LONG $MSFTGood luck traders
and if the price didn't go to the buying area , long it after a positive daily close upper 266

Microsoft’s Metaverse hype
The acquisition of Activision Blizzard could mark a new phase in Microsoft's metaverse development.

Microsoft’s $69 Billion Activision Blizzard cleared by Britain LONDON - Britain finally cleared Microsoft (NASDAQ:MSFT)'s $69 billion acquisition of Activision Blizzard (NASDAQ:ATVI) on Friday after it forced the Xbox owner to sell the steaming rights to games including "Call of Duty" to address its competition concerns.
The deal was blocked in April by the Competition and Markets Authority (CMA) which said it could give the U.S. computing giant a stranglehold over the nascent cloud gaming market.
But the regulator ripped up its play book by reopening the case after Microsoft agreed to sell the streaming rights to Activision's games to Ubisoft Entertainment, with remedies to ensure the terms were enforceable.
The deal was the biggest test of the CMA's global power to take on the tech giants since Britain left the European Union.
It said "sticking to its guns" in the face of criticism from the merging companies had delivered an outcome that was better for competition, consumers and economic growth.
The approval paves the way for Microsoft to close the deal by Oct. 18 after it extended the deadline to secure UK approval.
The CMA said Microsoft's concession on streaming was a "gamechanger", adding that it was the only competition agency globally to have delivered this outcome.
The new deal will stop Microsoft from locking up competition in cloud gaming as this market takes off, preserving competitive prices and services for UK cloud gaming customers," it said in a statement.
Microsoft announced the deal in early 2022, aiming to boost its growth in console, mobile, PC, and cloud gaming to compete with the likes of Tencent as well as PlayStation-owner Sony (NYSE:SONY).
The U.S. Federal Trade Commission opposed the deal but after failing to stop it, the CMA was left standing alone.

MSFT run LH & LL MSFT stil run in form Lower High and lower low.
IF MSFT can break 333$ again, may back test 335-336$
IF MSFT close below 328.9$, will drop to 324$/320$

Mircosoft breakout on watch MSFT should lift this market higher if it holds above the breakout trendline.
We could see a big rally in to tech earnings if economics data comes in positive.
