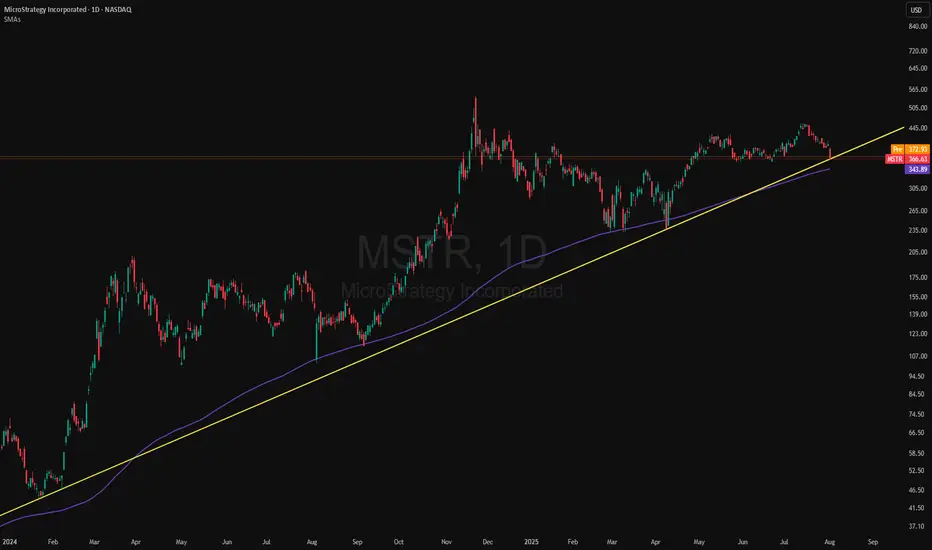
Buy MSTR - many indicators lead me to buy.Many, many indicators lead to a buy on mstr. Avwap, divergences, stochastic... strong buy for me. Stop loss at about 350$. Take profit could be set to 455$ (or adjust it while it's running). Of course it depends on the performance of btc, but I'm also bullish for btc (at least n short term).
MSTR trade ideas

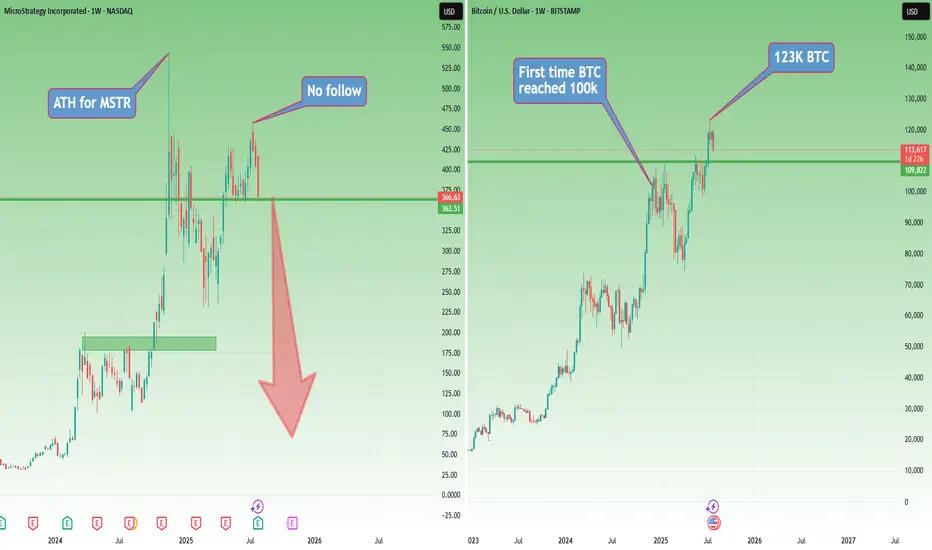
Why Pay $250K for a $115K Bitcoin? Welcome to Strategy (MSTR)This is already the third article I’ve written about Strategy (formerly MicroStrategy), and for good reason.
You don’t need to be a financial expert to ask: why buy a stock that simply mirrors Bitcoin’s price — but at a massive premium?
No matter how sophisticated the explanations may sound, or how many times you’re told that “if you don’t understand it, it must be brilliant,” the reality is much simpler — and much more absurd.
Buying Strategy today is like paying $250,000 for Bitcoin while the actual market price is $115,000.
It’s not about complexity. It’s about common sense.
I won’t dive too deep into it — no need to fight “financial sophistication” with even more sophisticated words.
The point is simple: buying Strategy is like paying me $10,000 just so I can hold your $10,000 and call it an “innovative capital deployment strategy.”
Sounds smart, right? Until you think about it for more than five seconds.
Now let’s look at the posted charts — simple and visual.
Strategy (MSTR) hit its all-time high in November 2024, right when Bitcoin first reached $100,000.
Then came a sharp correction of more than 50% for the stock.
Fast forward: even though Bitcoin went on to make new all-time highs, Strategy didn’t follow, it seems like people were finally starting to wake up.
When BTC peaked again in mid-July 2025, Strategy only managed to reach $455 — well below its November ATH.
Since then, BTC has pulled back about 10%, while Strategy dropped around 20%.
So much for the “outperformance” argument.
And here’s where things get even harder to justify:
In the past, some institutions bought MicroStrategy because they couldn’t hold Bitcoin directly. Fair enough.
But now? Spot Bitcoin ETFs are live, regulated, widely available, and charge tiny fees — without the leverage, dilution risk, or premium baked into Strategy.
So what’s the excuse now?
Where are we now?
At this moment, even though I’m not too happy about this week’s Bitcoin weakness, I remain cautiously bullish — emphasis on cautiously.
But let’s entertain a scenario.
If Bitcoin continues to correct, Strategy is sitting right on support. And if BTC breaks lower, Strategy will almost certainly follow — breaking support and heading toward the next level.
That next support? Somewhere around $240–250, depending on how deep the Bitcoin pullback goes.
But here’s the real question:
What happens if Bitcoin enters a true bear market?
Will Strategy — which just recently rebranded from MicroStrategy — be forced to rebrand again as…
NanoStrategy?
Just a Saturday thought.
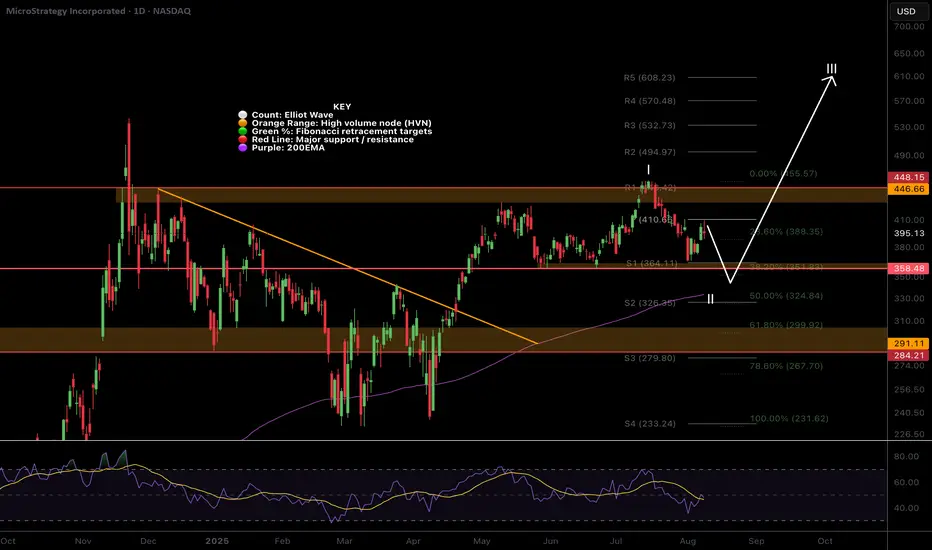
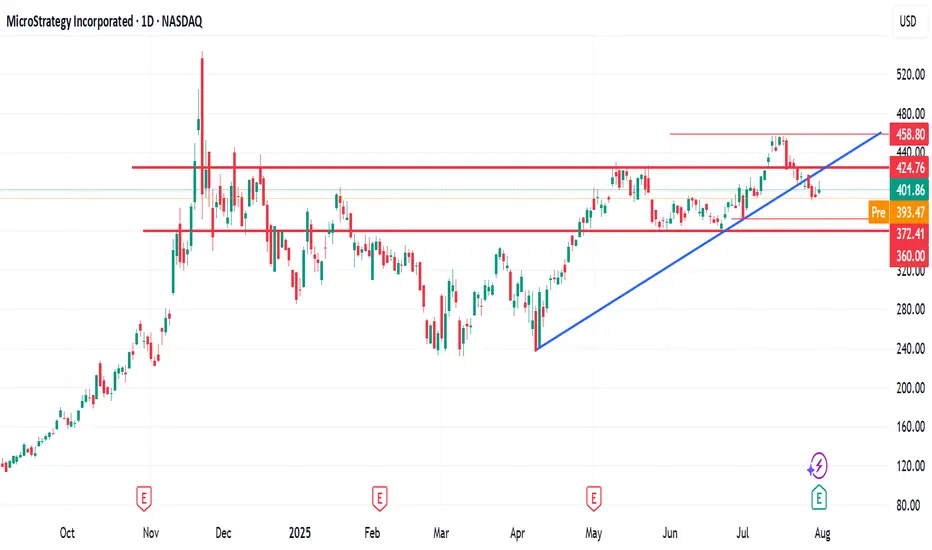
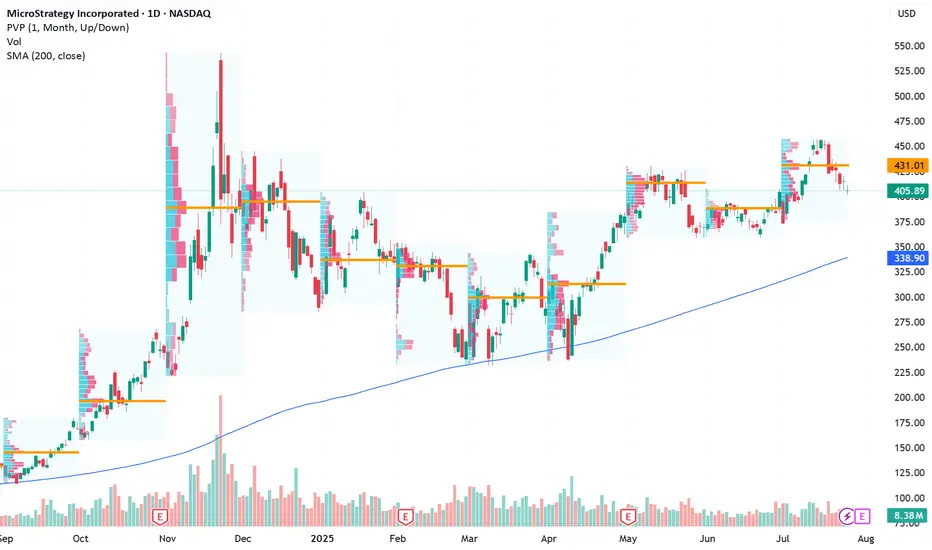
$MSTR shallow wave 2 underway before explosive move ?MicroStrategy has been caught in a range since Nov 2024 possibly building momentum for a large breakout into price discovery, continuing its huge rally from 2024.
Price appears to ave completed an Elliot wave 1 with wave 2 now underway with a target of the ascending daily 200EMA $340, the 0.382 Fibonacci retracement.
Weekly RSI is currently showing bullish divergence but daily suggests we have one push lower to get to oversold!
Bitcoin stocks have all had a decent retracement causing me to upgrade my Elliot Wave count to a completed macro wave 1 with wave 2 now underway, suggesting the best returns are still to come over the next months for this category asset class in wave 3!
Analysis is invalidated if we go to new highs above $457 or lose $229
New long signals are certainly building in the DEMA PBR and Price Action strategies so keep an eye out on the Trade Signals Substack as we have made very food profits lately in these markets!
Safe trading
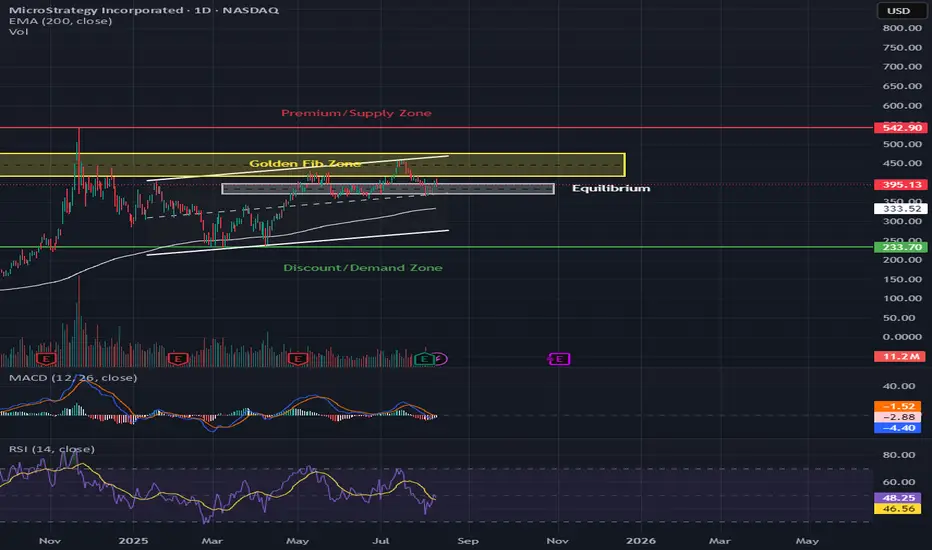
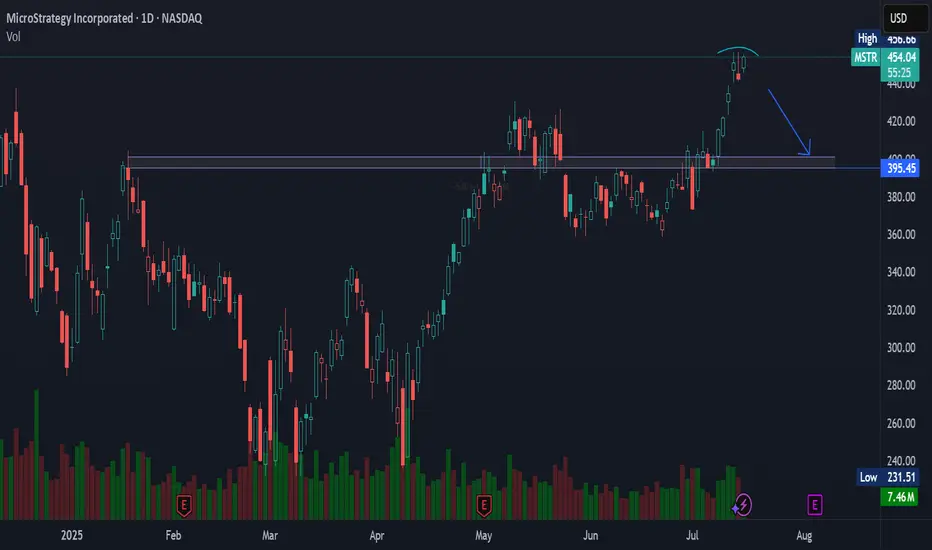
MSTR Testing Golden Fib Support – Bounce Back or Break Lower? 📊 Market Breakdown
MSTR is trading at $395.13, sitting right on the edge of the Golden Fib Zone ($395–$460) after recently failing to push through resistance. Price is holding above the equilibrium (~$333) for now, but with RSI cooling from overbought 74.41 and MACD momentum turning down, the next few sessions will decide if we bounce or break.
Trend: Strong bullish trend from 2024 lows, but recent price action shows consolidation near the top.
Key Structure: Holding above equilibrium keeps the bullish structure intact, but a close below $395 risks a drop toward $333 support.
Volume: Lighter compared to recent rallies, suggesting buying pressure is slowing.
Indicators:
MACD: Bearish crossover forming.
RSI: 66.85 – coming down from overbought, showing cooling momentum.
🛒 CALLS (Bullish Scenario)
Buy Zones:
🎯 Aggressive Entry: Hold above $395 with bullish daily candle
✅ Confirmation Entry: Break & close above $420
Take Profits:
1️⃣ $450 – Golden Fib Zone top
2️⃣ $490 – Minor resistance before supply
3️⃣ $542 – Premium/Supply Zone target
Stop-Loss: $385
Why This Works: Holding $395 and breaking $420 could spark a push back into the high $400s within 2–3 weeks.
🛑 PUTS (Bearish Scenario)
Sell Zones:
🚨 Aggressive Entry: Daily close below $395
📉 Breakdown Entry: Drop under $385 with momentum
Take Profits:
1️⃣ $333 – Equilibrium zone
2️⃣ $300 – Psychological support
3️⃣ $233 – Discount/Demand Zone
Stop-Loss: $410
Why This Works: Losing $395 puts MSTR at risk for a quick trip to $333, and possibly lower, as momentum shifts bearish.
🔍 Technical Highlights
Golden Fib Zone Test: This level is a decision point — bounce here is bullish, but a close below turns the chart bearish short-term.
Macro Watch: MSTR is heavily tied to Bitcoin’s price movement — BTC weakness = MSTR weakness.
⏳ Option Expiration Strategy:
1 Week: Short-term bounce or rejection plays around $395
2–3 Weeks: Swing toward either $450+ or $333 depending on breakout direction
MSTR: Dual Support Test - 200 SMA & Trendline Hold… for NowMSTR (MicroStrategy) is now testing a key technical zone that combines dynamic trendline support and the widely-followed 200-day simple moving average (SMA). These two indicators have provided critical inflection points for the stock over the past year - and we’re back there again.
The current pullback may offer a pivotal bounce opportunity if buyers step in at this technical confluence.
Technical Highlights:
Long-term trendline (from early 2024) continues to hold as support.
200-day SMA has triggered rebounds multiple times, aligning closely with the trendline.
Price action is compressing into a narrowing zone - watch for resolution.
A clean break below may signal deeper correction; holding here keeps the bull case alive.
8/1/25 - $mstr - Selling spot and buying MSTR8/1/25 :: VROCKSTAR :: NASDAQ:MSTR
Selling spot and buying MSTR
- keeping it (purposefully) short today for everyone's benefit
- sold a bit of OTC:OBTC (which is nearly 15% off spot, e.g. $100k/BTC) to buy NASDAQ:MSTR MSD exposure here
- why?
- 1.6x mNAV is lowest it's been (nearly ever in current BTC move)
- Saylor not going to hit the ATM sub 2.5x, will run it hot
- Latest product further augments this runway to value accretion
- BTC still remains REALLY well bid in this current tape
- So math is like this
- ROE of BTC in "conservative" sense is 25%
- Kc (cost of capital) for Strategy is 10% again (conservative, it's really sub 10%)
- so ROE/Kc (without growth) = 2.5x book.
- A real ROE for BTC (remember this is permanent capital he's tapping, so no asset-liability mis-match) is 35%
- True Kc for this is sub 10%, but let's still say 10%. that's 3.5x book.
Therefore let's even say 2x book (below both of the above) is 2/1.6 = 25% upside. If/do you think that BTC can go back to low 90s, ofc this might contract further (the 1.6x) but at the same time, you have EVEN higher implied ROE and R/R only improves.
So at a minimum, i'd guess your R/R is "balanced" here in the most conservative scenarios. And if we do get BTC bid, this will rocket at this stage thru YE and far exceed px appreciation of it's BTC pair.
Ok that was longer than I intended. Felt important to convey math and up/downside parameters.
Be well. Everyone loses money in correlation 1. Just make sure you find the betas that have the first bids. Right now that's BTC and some quality names doing 6-7% fcf yields and growing.
I like
OTC:OBTC (adding fuel w/ my NASDAQ:MSTR calls)
NASDAQ:NXT
NYSE:DECK
NASDAQ:LULU
NYSE:FI
<3
V

MSTR still bullish. MSTR bullishness is still intact but it should close above the upper yellow line for the bullishness confirmation intact. If that happens then there's a big possibility that we will see a big sharp last parabolic run to new ATH. Of course this is not financial advised.
If this failed then the last hope is on the Red Line.

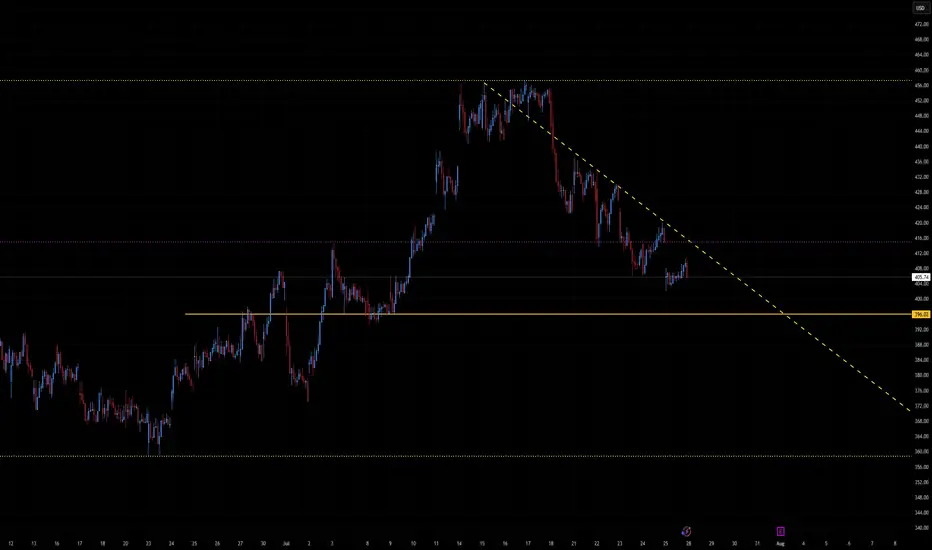
$372 - $360 is imminent$372 - $360 is imminent.
Following a break below the highlighted key support TL, MSTR fall to as low as $370 to $360
Monthly $MSTR Bullflag MicroStrategy is forming a textbook bull flag on the monthly, right after a massive vertical leg from sub-$200 to over $500.
Strong pole ✅
Tight consolidation near the highs ✅
Monthly closes holding above prior resistance ✅
This thing is coiling under ~$455. Once it breaks, it could easily send toward $800–1000+, especially if CRYPTOCAP:BTC keeps surging. BTC already confirmed a major cup & handle — MSTR just lagging a bit.
High timeframe structure + BTC correlation = explosive potential.
Watching for volume + breakout confirmation. Let’s see if it rips.

MSTR Holding VWAP Support – Reversal Attempt but Earnings AheadMSTR bounced nearly 2% today after testing anchored VWAP support near $390. This recovery comes after a steady pullback from the recent $460 high. Price is holding above the yellow VWAP and just above the green zone, signaling possible short-term support.
However, volume remains light (3.72M vs. 11.47M average), indicating cautious buying — and earnings are scheduled for tomorrow, which introduces added volatility risk. A close above $410 post-earnings would strengthen the bullish case.
Until then, this remains a speculative long setup with event risk.
Indicators used:
Anchored VWAP (support zone: $390–395)
Volume vs. Volume MA (light = indecision)
Earnings date = risk trigger
Entry idea: Only after earnings reaction; ideally above $410
Target: $430–440
Stop: Below $388 or earnings miss

MSTR NASDAQ:MSTR looks like it’s gearing up for a pullback — eyes on the $395 level for a potential retest.
Watch the support. 👀📉
#MSTR #Bitcoin #Stocks #Tech #Trading
Cocaine Saylor is coming for you! The man the myth the legendary cocaine snake oil saylor is BACK once again to take you out to the CLEANERS!! The infamous dot com bandit is going to snatch your 401k like an old grannys pocket book! BEWARE!!!

Strategy Hit SupportMSTR should easily hold $246 and make its way back up to $418 and form it's next support there.
Good luck!

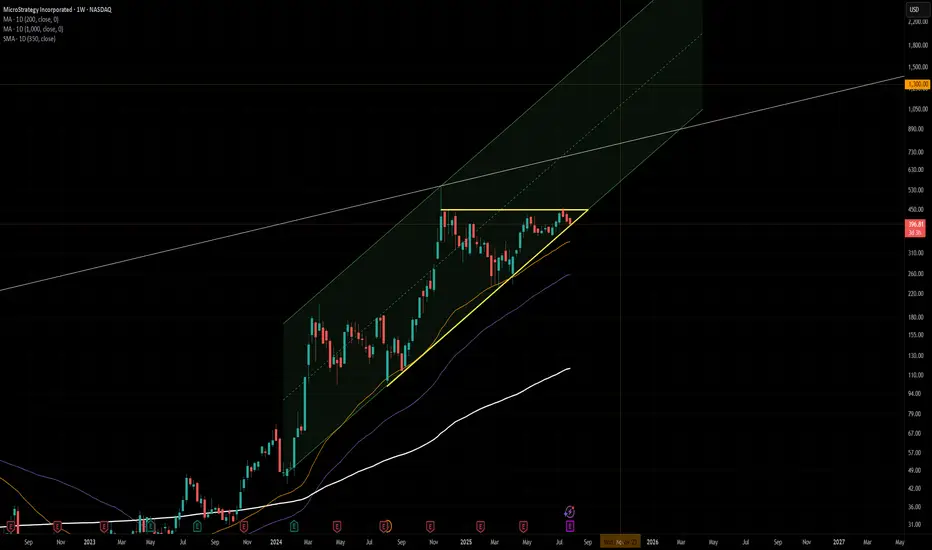
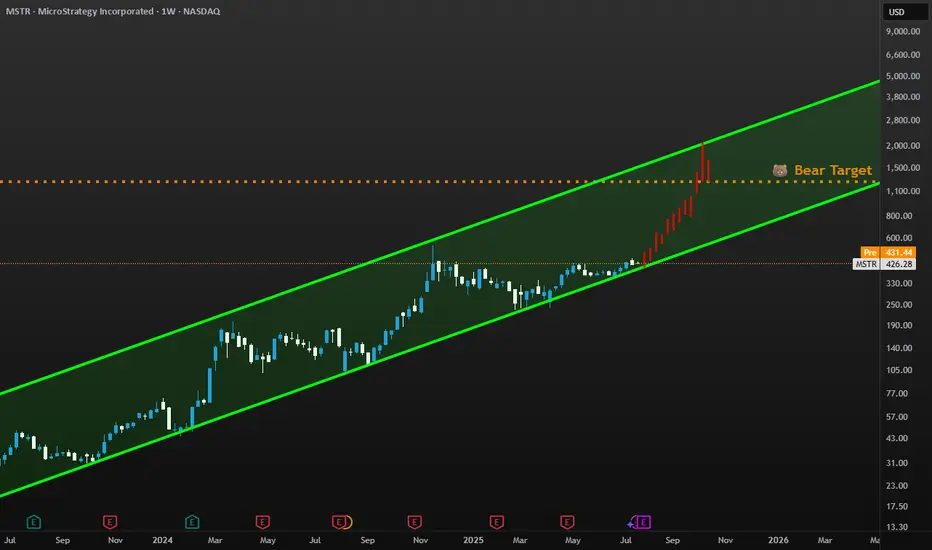
$MSTR Weekly Ascending TriangleMicroStrategy has been consolidating within a textbook ascending triangle pattern, with a clear resistance around $520 and rising higher lows forming solid support. Price action remains inside a strong bullish channel, hugging the 50-week MA and riding above the 200/350 MAs.
A breakout above $520 could trigger a strong continuation toward the upper bounds of the channel, with potential long-term targets around $1300 if momentum aligns with Bitcoin strength.
Watching for volume confirmation and weekly close above resistance for validation. Breakdown below the yellow trendline would invalidate the setup.
MSTR WEEKLY OPTIONS SETUP (2025-07-28)
### 🔻 MSTR WEEKLY OPTIONS SETUP (2025-07-28)
**Bearish Divergence with High Confidence — Time to Strike with a PUT?**
---
📊 **Momentum Recap:**
* **RSI:** Bearish 📉
* **Volume:** Weak (institutional exit risk)
* **Options Flow:** Mixed (calls > puts, but no alignment with price)
* **Sentiment Models:** Split 4:1 → **Only Claude/Anthropic** goes bearish with conviction
🧠 **Model Consensus:**
> “Momentum is weak, volume fading, and no upside confirmation = bearish edge.”
---
### ✅ SETUP OVERVIEW
* 🔍 **Trend:** Bearish (declining RSI)
* 📉 **Volume:** Weak = reduced institutional conviction
* 💬 **Options Flow:** Bullish bias, but **contradicts price trend**
* ⚙️ **Volatility:** Elevated, potential reward for directional plays
**Overall Bias:** 🔴 *Moderately Bearish*
---
### 💥 TRADE IDEA: MSTR \$400P
* 🎯 **Strategy:** Long Weekly Put
* 🔻 **Strike:** 400.00
* 📆 **Expiry:** Aug 1, 2025
* 💸 **Entry Price:** \$8.65
* ✅ **Profit Target:** \$12.50
* 🛑 **Stop Loss:** \$4.00
* 📈 **Confidence Level:** 72% (backed by Claude model)
* 📉 **Breakdown Trigger:** Below \$405 confirms bearish flow
* ⚠️ **Invalidation:** Break above \$415 → exit early
---
### 📦 TRADE\_DETAILS (Backtest/Algo Ready JSON)
```json
{
"instrument": "MSTR",
"direction": "put",
"strike": 400.0,
"expiry": "2025-08-01",
"confidence": 0.72,
"profit_target": 12.50,
"stop_loss": 4.00,
"size": 1,
"entry_price": 8.65,
"entry_timing": "open",
"signal_publish_time": "2025-07-31 09:30:00 UTC-04:00"
}
```
---
### 🧠 TRADE INSIGHTS
* 🟥 4/5 models say **no trade** due to signal divergence
* 🧠 **Claude’s bearish thesis = cleanest directional setup**
* 🚨 Volume + RSI combo = downside confirmation
* 🧭 Watch key price reaction zones: **\$400–\$405 (support)** / **\$415 (resistance cap)**
---
**#MSTR #PutOptions #WeeklyTrade #BearishSetup #OptionsFlow #QuantTrading #ClaudeModel #MarketMomentum**

Long-Term Bitcoin Proxy Positioned for Next Upside RallyCurrent Price: $405.89
Direction: LONG
Targets:
- T1 = $418.50
- T2 = $425.99
Stop Levels:
- S1 = $399.50
- S2 = $386.20
**Wisdom of Professional Traders:**
This analysis synthesizes insights from thousands of professional traders and market experts, leveraging collective intelligence to identify high-probability trade setups. The wisdom of crowds principle suggests that aggregated market perspectives from experienced professionals often outperform individual forecasts, reducing cognitive biases and highlighting consensus opportunities in MicroStrategy.
**Key Insights:**
MicroStrategy is uniquely positioned as the largest corporate Bitcoin holder, meaning its stock price is closely tied to Bitcoin's movements. The company holds over 68,000 BTC, making it a favored choice for investors aiming to benefit from Bitcoin's potential breakout. Recent bullish market sentiment and positive institutional positioning in cryptocurrency-related equities add strength to the Long scenario.
Short-term price metrics also confirm a bullish bias, with options flows targeting calls and aggressive price strikes above current levels. However, flexibility is required as Bitcoin remains highly volatile ahead of macroeconomic shifts and Bitcoin-specific technical resistance levels.
**Recent Performance:**
MicroStrategy's stock has gained momentum over the past month, trading in tandem with Bitcoin's recent stability in the $27,000-$28,000 range. Last week, MicroStrategy saw increased interest among institutional investors, as options targeting a sharp rally were opened at key resistance levels. This suggests confidence among professional traders about crypto recovery prospects.
**Expert Analysis:**
Analysts argue the stock could serve as a leveraged play on Bitcoin’s trajectory, especially during bullish setups like MicroStrategy’s upcoming quarterly reports. Some experts point to Bitcoin’s struggle to break above $30,000 as an immediate risk, yet highlight MicroStrategy’s firm association with Bitcoin as an advantage. Beyond crypto exposure, MicroStrategy’s operational restructuring and debt management efforts further bolster its appeal as a dual-tech and crypto equity.
**News Impact:**
MicroStrategy’s long-term strategy continues to blend Bitcoin maximization with tech-driven operational focus. Recent comments from management emphasize continued cryptocurrency accumulation despite market fluctuations, securing its place as a pro-Bitcoin institutional equity. The upcoming earnings report could provide deeper insights into strategic moves for 2024, driving a post-earnings rally.
**Trading Recommendation:**
MicroStrategy presents a compelling buy opportunity for investors betting on Bitcoin-led equity rallies. Technical setups align with improving sentiment and disruptive news catalysts around macroeconomic policies supporting crypto stability, triggering higher upside potential. Long setups above $405.89 show bullish targets to $418.50 and $425.99, while flexible stop placements provide downside protection amidst broader Bitcoin resistance risks.
MSTR - Where it goes only BTC knows📊 MSTR – MicroStrategy Technical & Bitcoin Correlation
Ticker: MSTR | Sector: Bitcoin Treasury Proxy / Enterprise Software
Date: July 26, 2025
Current MSTR Price: ~$405.89
Current Bitcoin Price: ~$118,127
🔍 Chart & Price Structure
Recent Action: MSTR declined from the ~$430–450 range and has consolidated around the $405 level, forming a tight base.
Support Zone: $395–$400 — prior volume cluster, recent dip buyers stepped in.
Weak Resistance: $415–$420 — a shallow supply zone; bigger resistance lies at ~$430.
Volume & Candles: Mixed volume, with small-bodied candles showing indecision near $405. Buyers are attempting to hold.
📈 Bitcoin Outlook & Influence
MicroStrategy remains tethered to Bitcoin’s trajectory. Recent BTC consolidation around $118K closely influences MSTR sentiment.
BTC Projections
From Citi (Jul 25):
Base Case: $135K by year-end
Bull Case: $199K
Bear Case: $64K if equities falter or ETF flows wane
Other Views:
Hashdex sees BTC reaching up to $140K in 2025
Omni Ekonomi
Global X ETF-based models anticipate $200K within 12 months
The Australian
Kiyosaki warns of potential crash despite optimism
These imply a possible 25–70% upside in BTC, which could drive MSTR toward $500–$600+ if holdings are stable.
⏱️ Short-Term Outlook (1–2 Weeks)
✅ Bullish Scenario
Trigger: Hold above support at $400, reclaim $415–$420
Immediate Upside Targets:
First: $430
Break above $430 → $450
Drivers: Bitcoin breaking back above recent highs, ETF inflows, favorable regulatory headlines
❌ Bearish Scenario
Trigger: Break below $395
Downside Targets:
$380 → $360 → $350
Drivers: BTC weakness → below $110K, altcoin rotation, broader equity weakness
🔭 Long-Term Outlook (H2 2025 / beyond)
🚀 Bull Case
If Bitcoin reaches $135K–$200K (Citi bull case, institutional demand, ETF momentum), MSTR could rally alongside to $550–$650.
MicroStrategy’s business fundamentals (data analytics/AI) may contribute optionality beyond BTC.
🐻 Bear Case
If Bitcoin retraces toward $64K or below due to risk-off sentiment or regulatory changes, MSTR could fall back toward $300–$350.
📊 Summary Table
View Trigger Level Targets Bitcoin Scenario Confidence
Short-Term Bull Above $405 and reclaim $415–420 $430 → $450 BTC > $118K and flat-to-up Moderate
Short-Term Bear Below $395 $380 → $360 → $350 BTC dips < $115K Moderate
Long-Term Bull BTC to $135K–$200K $550 → $600+ ETF inflows + adoption acceleration High (if BTC strength)
Long-Term Bear BTC drops below $110K $350 → $300 Sentiment collapse or regulation Moderate
🧠 Conclusion
MicroStrategy’s stock remains inherently tethered to Bitcoin performance. The $395–$405 zone acts as critical support, while a push above $415–$430 could signal renewed upside. Longer-term, BTC strength into the $135K–200K range would propel MSTR toward $600+ levels; a BTC pullback could drag it toward $300 or lower.
Watch Bitcoin flows, ETF updates, and pillar crypto adoption trends—these are likely to dictate MSTR’s next leg.
MSTR - Microstrategy Short...for now.The White Fork is created by choosing point A, which must be the lowest price before the swing.
B and C are the natural high and low of the swing we want to measure.
What this gives us is a Pitchfork that projects the most probable path of price.
Additionally, with the three lines that make the Fork, we have the natural extremes above, below, and the center—the mean.
We can see that price started to rise in March 2025.
The 80% rule states that price will reach the Centerline around 80% of the time.
And as we see, it did this time as well. Price reached the CL (Center Line), and immediately the big whales dumped positions.
Then price fell—only to be picked up before reaching the Lower Line, also called the L-MLH or Lower Median Line Parallel.
When price can't make it to this (or any of these) lines, we call this a 'Hagopian,' because it follows 'Hagopian's Rule.' This rule says that if price can't reach 'the line' (the L-MLH in this case), there is a high chance that price will reverse in the previous direction (up in this case), and even go further than where it came from (the Centerline).
And as we see, price indeed traded upwards—beyond where it came from—and overshot the Centerline (CL).
Unfortunately for long-positioned traders, the gas in the goose was empty, and price now starts to head south again, missing the target, which would have been the U-MLH (Upper Median Line Parallel).
So, the open happened below the CL!
If we also see a close this week, I'm ready to initiate a short trade.
Why?
Well, as before, Hagopian’s Rule applies—an indication that price will trade further down than where it came from, which is below $361.
And since we know that the natural target is the Centerline about 80% of the time, we have a heck of a good chance that we’ll be happy campers in a couple of weeks. :-)
With a risk/reward of about 2 to 3, and such a high chance of a profitable trade, I’ll sleep like a baby in the coming weeks.
The trade idea would be cancelled if price closes above the CL this Friday.
Let’s stalk it closely...

Possibility for MSTRIf bitcoin moves, Strategy moves.
I am no expert, so this is just for entertainment purposes.
But Strategy is acquiring bitcoin like there is no tomorrow and bitcoin inelastic supply tend to give a way to radical and fast grow in price.
Hence why I'd be keen to see MSTR move as much as I show in this chart.
MSTR – On the Path to New ATHI was initially skeptical about the recovery structure unfolding since the April lows — it looked like a possible macro lower-high before deeper correction (as outlined in my previous idea).
However, given the strength in underlying #BTC price action (covered in my recent video-idea on crypto trend structure) and clear signs of constructive consolidation and accumulation during the July breakout, Isee strong odds for follow-through toward the 520–570 resistance zone in the coming weeks.
This move may align with CRYPTOCAP:BTC testing its macro resistance near 130K (see my macro BTC analysis on the idea section).
If NASDAQ:MSTR can break above 570 and sustain a close above it, it opens the door to a potential immediate follow-through toward the 650–755 macro resistance zone. But a scenario for more prolonged consolidation around 570 would in fact serve as a solid base for more stable and prolonged next long-term leg higher.
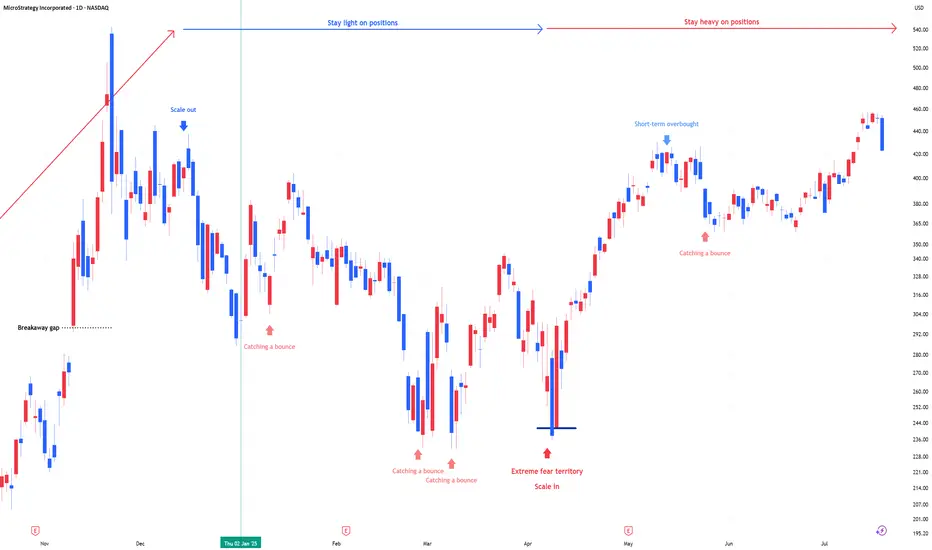
MSTR: Stay heavy on positions"MSTR position size is adjusted in line with US market and bitcoin signals for underweight or overweight allocations. During panic phases, 2x leverage ETFs are on the table."
Stay heavy on positions
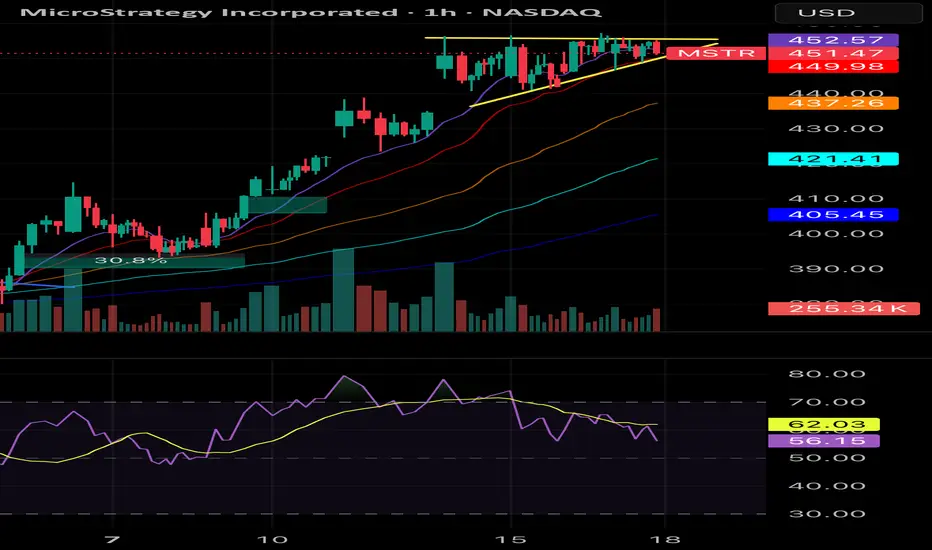
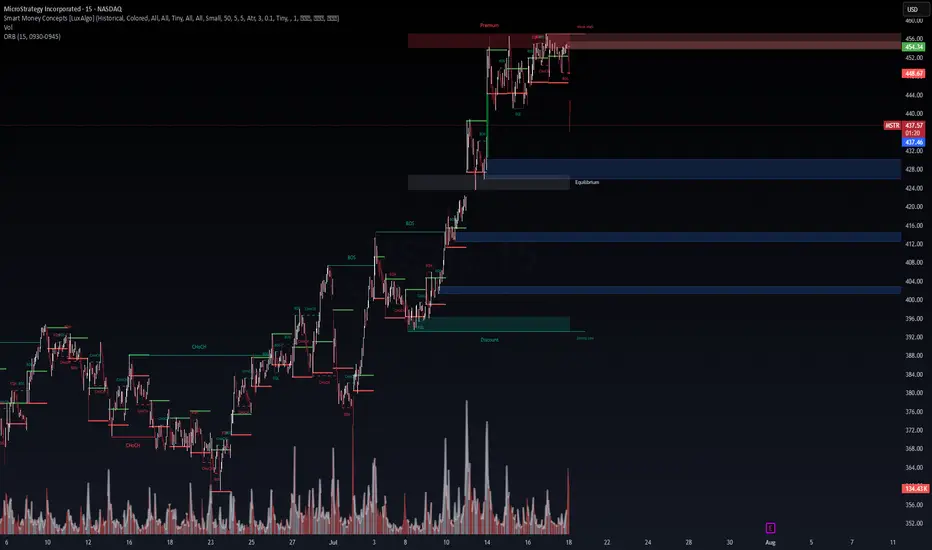
WaverVanir VolanX Protocol – Short Thesis: MSTR🔻 WaverVanir VolanX Protocol – Short Thesis: MSTR
Timeframe: 15-Min | Bias: Bearish | As of: July 18, 2025
Disclaimer: For educational and illustrative purposes only. Not financial advice.
🧠 Thesis Summary:
MicroStrategy (MSTR) has broken market structure at a key premium zone, rejecting from the weekly high, with strong volume confirming distribution. The smart money appears to have exited positions, leaving behind a clear imbalance and liquidity void below.
🔍 1. Smart Money Concepts Breakdown
Premium Zone Rejection (454–456): Price rejected from a premium inefficiency pocket, tagged liquidity, and failed to make a new high.
Internal CHoCH and BOS at Top: Multiple Change of Character (CHoCH) and Break of Structure (BOS) events indicate smart money is offloading.
Fair Value Gap (FVG) Below: Several unmitigated FVGs below (≈412, ≈404, ≈396) serve as magnets for price.
⚠️ 2. Liquidity Sweep Confirmed
Equal Highs Taken Out: Perfect setup for liquidity engineering – retail traders trapped long above 454.
Displacement Candle: Sharp move down post-sweep confirms institutional sell-off.
Volume Spike at Breakdown: Selling volume surged on the red candle through 440 support, indicating urgency from sellers.
🧮 3. ORB Breakdown & VolanX ORB Confluence
Opening Range Breakdown (ORB 15min): ORB low at 448.67 was decisively broken.
Current price: 436.30, firmly below both ORB midpoint and low – signaling bearish continuation.
🧭 4. Probabilistic Price Targets
Target Area Price Level Rationale
TP1 428.00 Equilibrium block
TP2 412.00 Imbalance fill + previous BOS
TP3 396.00 Deep discount zone + Strong Low
Stop Loss: Above 456
Risk-Reward (TP2): 1:3+
Volatility: Elevated (Vol: 129.97K)
🧩 5. Macro & Correlation Risk
Bitcoin Correction Imminent: MSTR is heavily correlated to BTC. Any weakness in crypto adds pressure.
Rate Cut Uncertainty: Hawkish Fed tone or delayed cut could hurt growth narratives and tech multiples.
📉 Summary:
This is a high-probability short setup powered by:
Premium zone rejection
Clear BOS and CHoCH pattern
Strong volume confirmation
ORB breakdown alignment
Liquidity engineering dynamics
VolanX Protocol flags this as a Strategic Short Opportunity targeting liquidity zones below.
🔻 Suggested Trade (Illustrative)
plaintext
Copy
Edit
Entry: 440–436
Stop: 456
Target 1: 428
Target 2: 412
Target 3: 396
#WaverVanir #VolanXProtocol #MSTR #SmartMoneyConcepts #ORB #ShortSetup #LiquiditySweep #DirectionalBias
MSTR's ASCENDING TRIANGLEMstr appears to be in an ascending triangle. Broke out of a wedge I tracked a while ago, crypto is breaking out in general and bullish crypto legislation is being passed. MSTR thus has potential to breakout all the way up to 500 or more. nfa