MSTR📊 MicroStrategy (NASDAQ: MSTR) – Technical & Simple Fundamental Analysis
1️⃣ Technical Analysis
🔍 Overall Trend Analysis
Long-term uptrend remains intact, but the stock is currently in a pullback phase from its $500 peak.
Testing 50-day EMA support ($238.91) – a key level for bulls to defend.
Short-term momentum is bearish, with declining RSI and a bearish MACD crossover.
📌 Key Levels
✅ Support Zones:
$230 - $240 → Testing 50-day EMA, crucial support.
$180 - $200 → Stronger demand zone if $230 fails.
$120 - $140 → Near 200-day EMA ($118.00), deeper correction level.
Below $120 → Supports at $100, $80, $60, $40 (historical levels).
🚀 Resistance Zones:
$280 - $300 → Immediate resistance after rejection.
$340 - $360 → Next resistance from recent peaks.
$420 - $500 → All-time high resistance.
📉 Indicators & Volume
📊 Moving Averages:
9-day EMA: $297.18 (short-term resistance).
20-day EMA: $297.58 (confirming short-term bearish trend).
50-day EMA: $238.91 (being tested as support).
200-day EMA: $118.00 (long-term uptrend remains intact).
📉 RSI (43.94) → Approaching oversold territory.
📉 MACD → Bearish crossover, showing downward momentum increasing.
📊 Volume → Selling volume increasing, but not extreme yet.
🔭 What to Watch Next (Technical)
✅ Bullish case: Price holds $230-$240 & reclaims $280.
⚠️ Bearish case: Break below $230 → Potential drop to $200 or lower.
2️⃣ Fundamental Analysis NASDAQ:MSTR (Simplified)
📌 Revenue: $57.53M (-3% YoY), Net Loss: -$670.8M in Q4 2024.
📌 Bitcoin Holdings: 478,740 BTC (~$45.1B market value, acquired for $31.1 billion).
📌 Capital Raising: Issuing $21B in preferred securities to fund further Bitcoin purchases.
📌 Stock Performance: Down last 3 months
📌 Workforce Cuts: Laid off 20.7% of employees in 2024.
📌 Rebranding: Now officially called "Strategy", symbolizing its Bitcoin-focused direction.
🔭 What to Watch Next (Fundamental)
✅ Bitcoin price movement – heavily influences MSTR.
✅ Earnings improvements – need to reduce losses.
✅ Institutional buying trends – support or sell-off?
🔥 Final Thoughts: MSTR is at a critical support zone. If Bitcoin remains strong, a bounce is possible. However, a breakdown below $230 could trigger deeper downside. 🚀📊
MSTR trade ideas

Can MicroStrategy Save Bitcoin's Destiny?MicroStrategy’s dramatic stock decline has become a bellwether for the broader digital asset market. As its share price plunges, the company’s deep ties to Bitcoin spotlight a precarious balance between corporate strategy and the volatility inherent in the crypto space. This unfolding scenario challenges investors to reconsider the intertwined fates of traditional finance and digital innovation.
The company’s approach to using Bitcoin as a primary treasury reserve has been revolutionary and risky. Aggressive accumulation strategies, including debt financing and Bitcoin-backed loans, have magnified the impact of market fluctuations. With critical support levels now under threat, the risk of forced asset sales looms large—an event that could cascade through the crypto ecosystem and undermine confidence in digital currencies.
Amid these challenges, MicroStrategy is also pursuing bold financing initiatives to stabilize its operations. Plans to raise $21 billion through a preferred stock offering signal a dual objective: securing necessary capital and further investing in Bitcoin. This move reflects an ongoing commitment to a Bitcoin-centric strategy, even as recent transactions have resulted in significant unrealized losses.
In parallel, the cryptocurrency landscape faces unprecedented headwinds from regulatory pressures, geopolitical tensions, and emerging technological vulnerabilities. Financial professionals are compelled to balance risk with opportunity, rethinking investment strategies amid an environment where innovation meets uncertainty at every turn.
The looming threat of quantum computing adds another layer of complexity. As quantum technologies advance, their potential to break current cryptographic standards—on which Bitcoin’s security fundamentally relies—poses a significant risk. Should quantum computers overcome encryption protocols like SHA-256, the very foundation of blockchain technology could be compromised, forcing the industry to adopt quantum-resistant measures rapidly. This challenge not only underscores the volatility of the digital asset market but also inspires a deeper exploration into safeguarding the future of decentralized finance.

MSTR burn baby burn....you've been warnedBTC keeps dropping and MSTR keeps dropping like a brick. I've been calling this out for months, and now it's a reality. Leverage MSTZ (inverse) to benefit from this situation. A lot of upside!!! 23% so far :)
All the best and always do your own due diligence!

Up to 329 until tomorrow then drop to 120 , my 2 centsThis channel is not providing individualized trading or investment advice, nor is it a banking service, brokerage service, trading service, investment service or money management service.

MicroStrategy (MSTR) at a Pivotal Level – What's Next?📊 Technical Analysis (TA) & GEX Breakdown 📊
Market Structure & Price Action:
* Trend: MSTR is consolidating after a strong bullish move but is testing a key support trendline.
* Resistance Zone: $320.94 – This level aligns with previous price action and a reversal zone.
* Support Levels: $285.10 (current bid) and $281.26 – If this zone breaks, downside risk increases.
* Volume & Momentum: Declining volume on pullback suggests a potential bounce, but buyers need to step in soon.
Indicators Overview:
* MACD: Slight bearish crossover, indicating potential short-term weakness.
* Stoch RSI: Oversold conditions, which may hint at a reversal if buying pressure increases.
GEX & Options Sentiment Analysis:
* Call Wall Resistance: $330 – A breakout above this level could trigger gamma squeezes.
* Highest GEX Call Resistance: $350 – A major level where dealers could hedge aggressively.
* Put Support Wall: $250 – If price breaks lower, this is a major defensive zone.
* Implied Volatility (IV): Elevated IV suggests high expected movement, favoring option sellers.
* Options Sentiment: 85.1% Calls Dominance – Bullish positioning, but needs follow-through.
Trade Outlook & Strategy:
* Bullish Scenario: Holding the $285 support and reclaiming $300+ could lead to a retest of $320-$330.
* Bearish Scenario: A breakdown below $280 may accelerate downside to the $250 support wall.
* Key Level to Watch: $290-$295 zone – a reclaim could fuel further momentum.
🚨 Final Thoughts:
MSTR is at a critical decision point. A hold above $285 could lead to an upward push, but failure risks testing lower support levels. Options data supports bullish flow, but price action needs to confirm. Trade cautiously and watch key levels closely.
📌 Disclaimer: This analysis is for educational purposes only and does not constitute financial advice. Always do your own research and manage risk appropriately. 🚀

Microstrategy ?????Well first off all a very strange concept being backuped as a company only by the value of the Bitcoin, but who cares I mean if Blackrock and the USA hold Bitcoin as an huge asset you can be sure its quite safe. But since its connected to the Bitcoin it goes down when the Bitcoin goes down which will be the case. Question is how much Bitcoin will fall for a retracement.

$MSTR 618 FIBONACCI STRIKES AGAINGave yall this AMAZING Fibonacci Setup 2 weeks ago
Drop a like and Ill share the next buy setup!

Bollinger Bands for Beginners: The Price Hug Explained!Confused by Bollinger Bands? In this quick video, I break it down in plain English—think of them as a stretchy envelope around stock prices! Learn how traders use them to spot highs, lows, and big moves, plus why they’re not a magic trick. Perfect for newbies!

MSTR Repeating Previous Patterns?NASDAQ:MSTR seems to seesaw with the 100MA and it is approaching the MA which should see the stock move up and touch the upper resistance of the wedge. Then the price falls below the MA100 and goes through an accumulation stage.
The increased news of a US Bitcoin reserve could help this move up. Lets set the target of $335

MicroStrategy may rise to $355 - $404NASDAQ:MSTR
Long positions above 230 with targets at 355 & 404 in extension.
Alternative scenario
Below 230 look for further downside with 193 & 160 as targets.
The RSI has just landed on a support around 30% and is reversing up.

Arrow Points The WayThe price has bounced off this trend line every single time and bounced 138% the last two times. Could it happen again? Will it happen? We shall see.

MSTR...good time to get out!!You've been warned, MSTR is on the brink of turning a sharp corner south of the border. I found MSTZ (inverse) a really good leverage ETF to catch this. The case for BTC is becoming weaker breaking the 80k price level and it typically means that it will happen again. Don't let the crypto reserve etc. fool you. We all saw what happened with the Trump crypto coin, it was a cash grab and the same thing is happening with much of the crypto world. The original case (non-banking reliance) for BTC post financial crisis is being span around and the financial companies don't even have the compliance guidelines or the manpower to take it on. We are not going to buy vegetables with crypto anytime soon, maybe in the medium distance future, but for today the volatility is pushing down on BTC, which means that MSTR will get impacted.
Best of luck and always do your own due diligence!

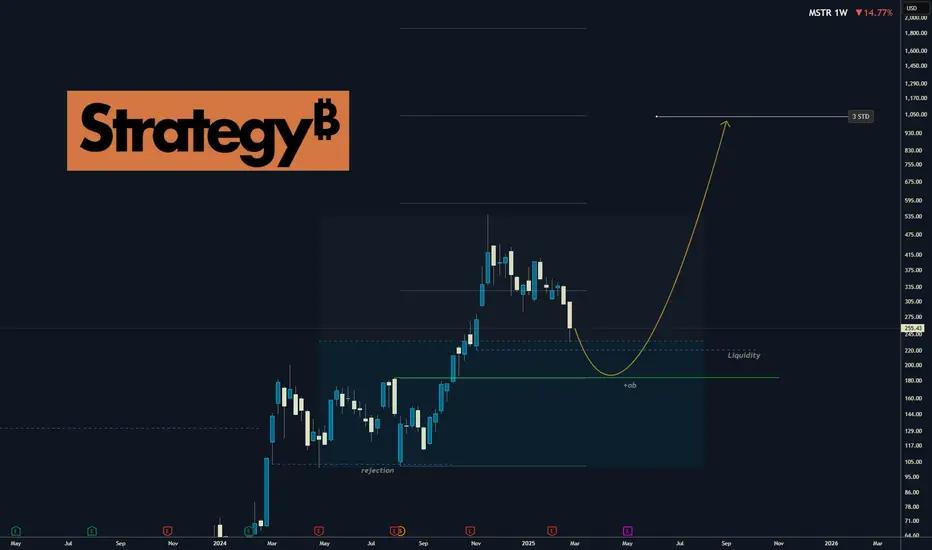
STRATEGY I Huge upside potential. Why it's great long term buy.This is not a short-term trade as you know from me on FX, Crypto and Indices. This is buy and hold investment. I got already good bag of share and I'm still adding without trying to time if perfectly, but now I think its time to buy bigger positions.
MSTR is my 2nd biggest position after the Bitcoin and TESLA). Many people thinks its a risky and that the company must sell BTC if price drops. Which is not true. Just let me explain.
Why MicroStrategy is Considered a Top Investment
MicroStrategy, led by Michael Saylor, is often seen as a leading investment for those wanting to invest in Bitcoin through a stock. The company holds significant Bitcoin (nearly 500K BTC) as its primary treasury asset and has been buying more using funds from convertible bonds and other financing. In 2024, its Bitcoin holdings were worth around $25 billion, and its stock rose nearly 400% due to Bitcoin's price surge. They are still buying more and their goal is 1 milion BTC.
How They Work with Convertible Bonds
MicroStrategy issues convertible senior notes, which are bonds with low or zero interest rates that can be converted into its stock at a predetermined price. For example, in November 2024, it issued $3 billion in 0% notes due 2029, with an initial conversion rate of about 1.4872 shares per $1,000, equating to a $672 conversion price MicroStrategy completes $3 billion convertible notes offering By Investing.com. Bondholders can choose to convert into stock if the price is high, or demand cash repayment under certain conditions, like on June 1, 2028. This allows MicroStrategy to raise capital without immediate stock dilution, using the funds to buy more Bitcoin.
What If the Price BTC price Drops Significantly
If MicroStrategy's stock or Bitcoin price drops significantly, bondholders might not convert their bonds, preferring to redeem them for cash. Here many investors things that MSTR will have to sell BTC. In the fact yes. But they are borowing long-term with zero interest.
Thoughts on MSTR Liquidation Risk:
The only liquidation risk I can see is via their convertible debt offerings:
1) If convertible debt buyers do not convert to shares before maturity, it forces MSTR to sell BTC to reimburse debt holders.
2) This would happen if MSTR doesn't pump more than ~40% in 5-7 years (varies according to each bond, see table below)
Basically either MSTR correlation to BTC needs to fail or BTC needs to fail.
There's other risks of varying magnitude:
- Competition risk, others copying the playbook reducing MSTR premium to NAV
- SEC intervention risk of future buys, reducing MSTR premium to NAV
- Custodial risk at Fidelity and Coinbase
- US nationalisation risk (seize the BTC)
- Saylor key man risk
- MSTR operational risk
In the end every invesment you do comes with risk. If there is no risk no gain will be possible.
Hope this clear your hesitations, let me know your opinions abou this stock.
Good Luck
David Perk
MSTR - 3 Potential Support LevelsPotential Support levels are where the green small arrows are:
white L-MLH
red CL
red L-MLH
All tough, I think MSTR Ponzi will dye over the mid term.

MSTR down she goes....value gapLet's be honest, 9% bump for MSTR is like getting socks twice on Christmas! There is zero value here and will drop so hard. There could be some bubbles from the pro-crypto administration, but there is no long term play there, it's just hot air for a cash grab.
Check out MSTZ....it will pop, but you need to do it fast and get out fast too!
Best of luck and always do your own due diligence!

MicroStrategy bouncing off 200 MAWe have also seen S&P 500 bounce off its own 200 day average, while the Nasdaq is coming off earlier lows. Meanwhile Nvidia is now positive on the session after starting the da below $110. So, a bit of a bounce back for stocks- is this the turnaround?
MicroStrategy could start next leg up here, if it again holds the 200-day average support near $235.
By Fawad Razaqzada, market analyst with FOREX.com

All's dropping as planned, but the target shifted.MSTR's correction is 50% complete, the final target is unclear and requires close monitoring.
A range of 90-150 is possible. Good luck!

MSTR to drop below $200You've been warned. MSTR will drop below $200. There is no hope here esp with the liquidity squeeze and dropping BTC (it dropped to high 70k yesterday!). Best thing you can do is MSTZ, and leverage the situation.
Do your own due diligence, best of luck and don't let crappy times get to you. If there's volatility and direction, you can make some mula :)

MSTR IS JUST GETTING STARTED - ONLY FOOLS SELL NOW!MSTR and Bitcoin are gearing up for the biggest bull run you've ever seen. Its unbelievable how many people are selling now thinking the bear market is starting and the bull run is over. Its crazy how many bears are flooding X and other platforms. It makes me laugh people calling Saylor a top signal and stupid. Saylor is not stupid and to think that you're smarter than him is just dumb. These rich dudes and hedge funds know whats going on, way better than anyone on here or any other platform. They control the markets, they have the money to make the charts do what they want. Dont be fooled.
None of this is financial advice. Just my opinion. Follow me for more charts and updates.

The BIG 300? MYTH OR REALISTIC?Closer to the 300 mark and consistently has sold off, but it looks like a good turning point. Again, it could temporarily slow down and consolidate in this region. Still, a breakout is pending, and 300 plus is undoubtedly not far-fetched as this has performed with volatility in the past, at almost high levels of reversal.

MSTR closing in on critical break level. Previously I pointed out the MSTR possible topping pattern at the 4.23 and spoke at length about how this pattern tends to predict a revisit of the 1.27.
This 1.27 move is always a crash and in a pattern like this tends to come in at around a 76% drop from the high.
Now MSTR is heading into the 2.20. If this level breaks we usually have a period of capitulation to not less than the 1.61. Most of the time the 1.27 ultimately ends up hitting/

I heard we're selling kidneys to back speculative bets. If it all comes to pass Saylor was just a troll who stuck to the bit, I'd feel this made a lot of sense given he tends to say things that are either trolling or insane.
And I'd like to think more people listen to a troll than an insane person.
Anyway, up review of his latest advice to sell a kidney rather than selling BTC, I'd like to announce my plans for gambling the proceeds of body parts.
If we get to 320 I'm selling my kidney to buy the 180 puts in MSTR.
I'll be an investor. Doing investor things.

MicroStrategy's Path: Prepare for Volatility and Short Squeeze P
- Key Insights: MSTR's connection to Bitcoin creates high volatility, making it
a candidate for short-term trading strategies. With crucial support at $142
and resistance at $543, watch for price movements that could trigger a short
squeeze. The current market sentiment suggests active trading around these
levels, driven by broader cryptocurrency trends.
- Price Targets: Next week targets include T1 at $1,050 and T2 at $1,120,
reflecting a potential bullish trend. Stop levels for LONG positions are set
with S2 at $138 and S1 at $142, adhering to the required hierarchy S2 < S1 <
975.91 < T1 < T2.
- Recent Performance: MSTR's recent market activity has showcased significant
fluctuations, closely mirroring Bitcoin's price movements. The stock has
experienced sharp declines in correlation with Bitcoin dips, but the
potential for reversal exists as support levels are tested.
- Expert Analysis: Experts emphasize the importance of monitoring price levels
closely for potential short squeezes. The market sentiment remains
cautiously bullish with a focus on recovery, provided MSTR can maintain its
support. Analysts suggest remaining vigilant as the cryptocurrency landscape
evolves.
- News Impact: Recent fluctuations in Bitcoin have had substantial adverse
effects on MSTR's stock price. Investor sentiment is heavily influenced by
changes in the cryptocurrency market, highlighting the risks and
opportunities that lie ahead for MSTR as it navigates these dynamics.
