NIO Setting Up for a Big Move!🚨 NIO ALERT 🚨
Looks like a buy & fly setup is loading! 📈💥
📊 Technicals aligning beautifully with macro cycle support.
🔥 Volume picking up. The structure looks explosive.
📍 A clean breakout could send this EV beast soaring!
I'm watching closely for confirmation...
This could get FAST. ⚡
NIO trade ideas

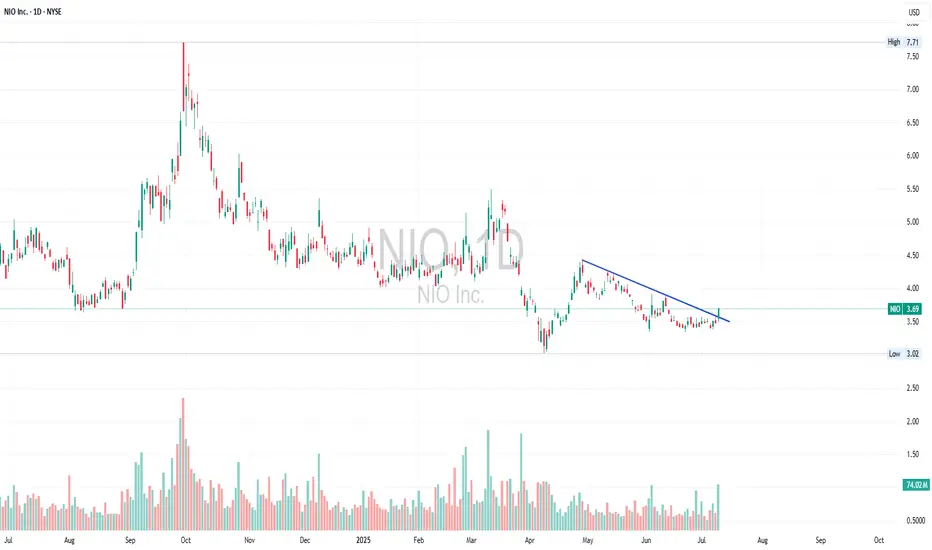
NIO BREAKOUTChinese auto manufacturers are under tremendous pressure—only a few will survive this squeeze. Among them, NIO is making a bold move into Europe. The stock’s price chart is showing a breakout from a classic falling wedge formation—a bullish reversal pattern typically signaling a strong move upward.
Technically:
The breakout from the wedge aligns with increasing trading volume and several technical indicators pointing upward, including RSI and MACD.
Multiple analysts confirm that NIO is positioned “right at the apex of a narrowing wedge,” suggesting an imminent breakout.
Additional charting from Reddit confirms this view, noting that pre-market action in Hong Kong and Singapore showed a breakout above the wedge boundary, targeting the $5.05–$5.20 range.
Fundamental context:
NIO is expanding aggressively into Europe (Norway, Germany and more), a move that strengthens its long-term growth narrative.
While domestic pressure in China remains elevated—due to fierce competition from players like BYD—this European strategy adds a meaningful growth lever.
My price target of $18 reflects a confluence of factors:
It corresponds roughly to the VWAP near NIO’s all-time low—a logical area for institutional interest.
It also represents the measured rally from a falling wedge breakout, assuming a full-range thrust.

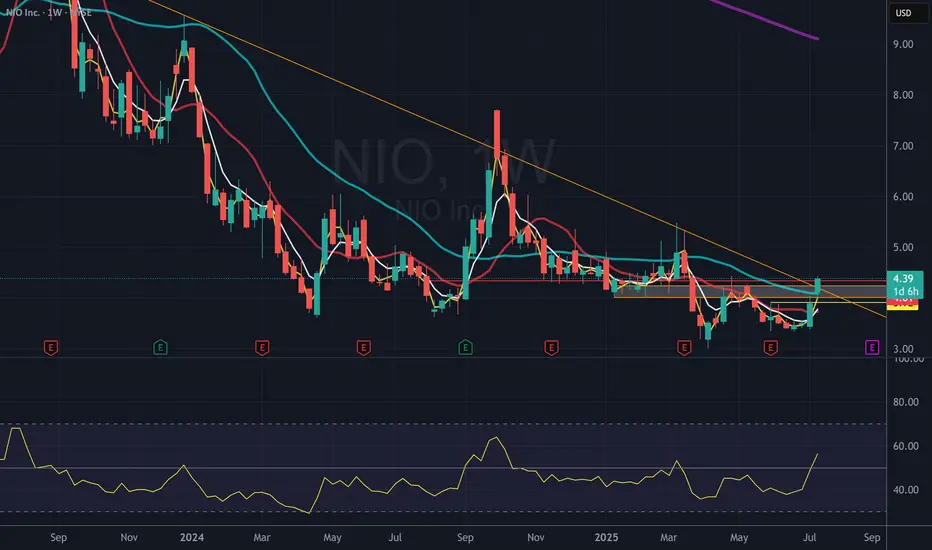
NIO smashing overhead resistanceWill start position with weekly close above 4.35.
Initial stop below 3.75 as choppiness expected
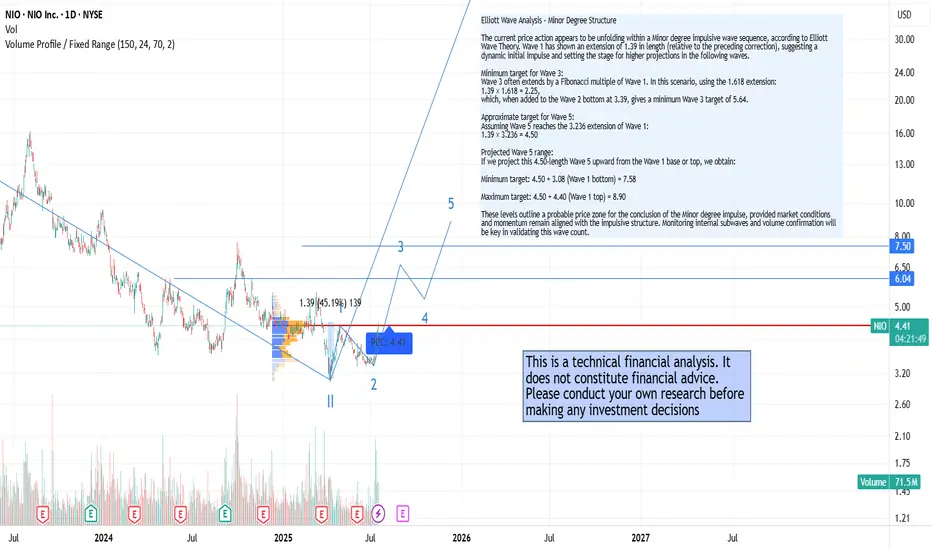
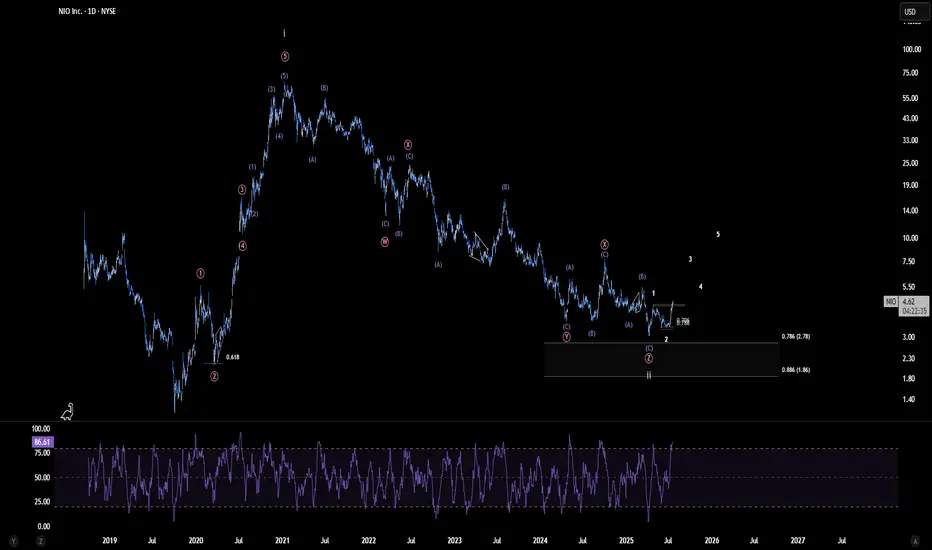
New Highs Ahead?In recent sessions, Nio Inc. has shown a price acceleration consistent with a Minor degree impulsive wave, as outlined by Elliott Wave Theory. Wave 1 has extended by a factor of 1.39, and the current price structure suggests a possible completion of Wave 3 and an early development of Wave 5, with clear technical targets already in place.
This technical scenario aligns with recent positive developments on the fundamental side:
🔹 Stronger delivery numbers – The latest quarterly results reveal robust year-over-year growth in vehicle deliveries, highlighting the company’s ability to scale production and meet rising demand. This performance is further enhanced by an improved product mix, with a shift toward higher-end or newer models, which contributes to stronger revenue per unit and improved brand positioning.
🔹 Battery swap network expansion – The company is steadily expanding its battery swap infrastructure. This innovative model, which allows EV drivers to swap a depleted battery for a fully charged one in just a few minutes, differentiates the company from traditional EV players. It also reduces charging time anxiety, increases convenience, and aligns with long-term goals for energy and fleet efficiency—particularly in dense urban areas and high-mileage use cases like ride-hailing or logistics.
🔹 New market entries – The company is actively pursuing international expansion, with strategic launches in Europe, including growing presence in countries like Germany, the Netherlands, and Norway. At the same time, it's establishing key partnerships in the Middle East to prepare for future entry into high-potential markets such as the UAE and Saudi Arabia. This geographic diversification not only broadens the customer base but also strengthens global brand positioning in the premium EV segment.
🔍 Key Highlights – NIO Mid-2025 Update
📈 Vehicle Deliveries
June 2025: 24,925 vehicles delivered (+17.5% YoY)
Q2 2025: 72,056 vehicles (+25.6% YoY)
1H 2025 total: 114,150 units (+30% YoY)
Cumulative deliveries: 785,714 units as of June 30, 2025
🔋 Battery Swap Network
Global footprint: Over 2,700 stations (2,400+ in China, ~60 in Europe)
China: ~2,651 stations, with 159 in Shanghai
Europe: ~60 stations, notably in Germany and Norway
Utilization: Peak stations in Shanghai exceed 100 swaps/day; global average ~30–40
💡 Takeaway
These strong operational metrics confirm accelerating growth and strategic infrastructure expansion, reinforcing NIO’s unique value proposition in the EV sector. The fundamental momentum aligns with bullish technical signals, including an unfolding Elliott Wave pattern projecting higher targets.
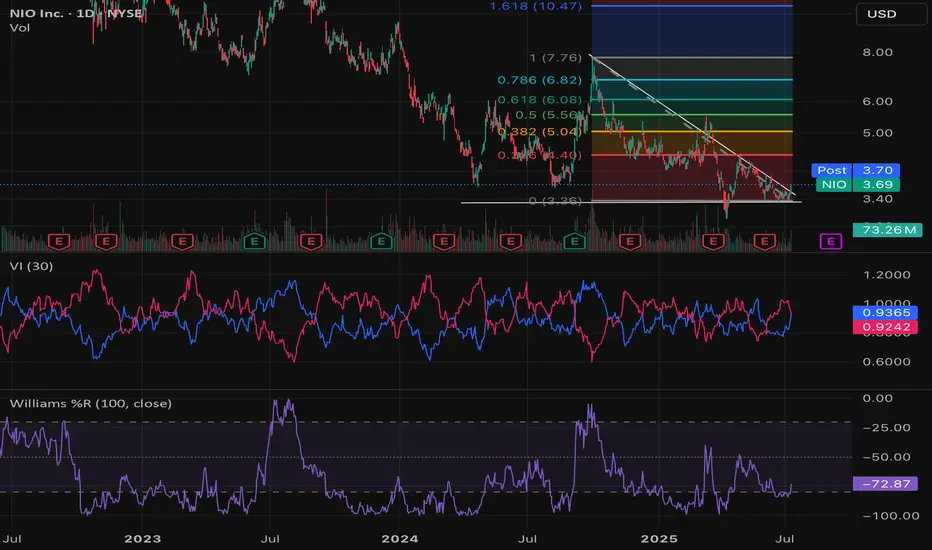
Based on the current Elliott Wave projection:
Minimum target for Wave 3: 5.64
Projected Wave 5 range: between 7.58 and 8.90
In summary, we’re observing a technically and fundamentally aligned scenario where price action is increasingly supported by improving financials and strategic execution on the ground.
This is not a financial advise, please do your own research.
Nio - Best caseHere my best term scenario on Nio
We may have bottomed out as we have started to see bullish price action but tread with caution. once we have candle closure on weekly above that weekly breaker block i am looking ath this level to be our launchpad higher with the best case; is that we reach our long term target between 25-37

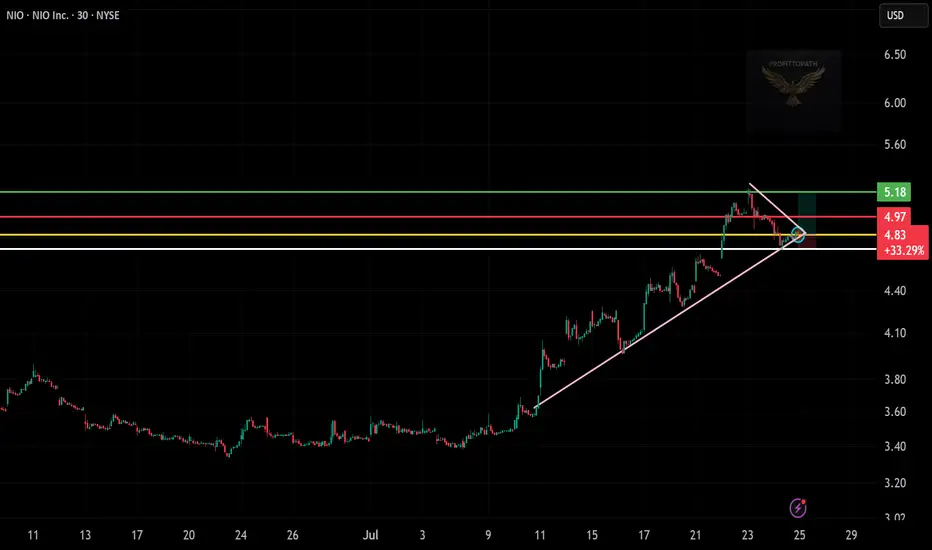
NIO Setup Looks Strong – Watch This Move!
Pattern: Bullish breakout from descending wedge
Entry Zone: Around $4.83–$4.97
Stop Loss: Just below $4.70 (trendline + horizontal support)
Target: $5.18 (green resistance level)
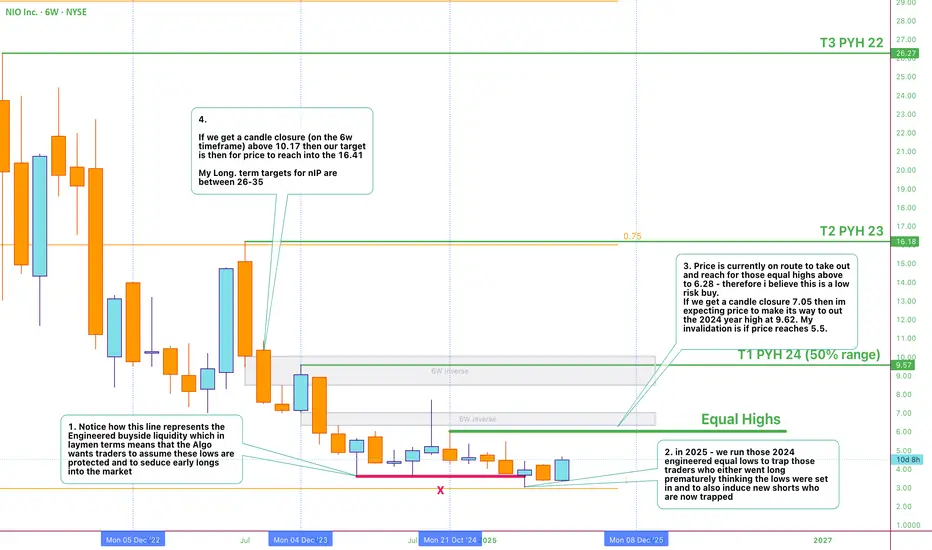
Its a NIO thingin 2025 we made a run on the 2024 lows- is this indication of further lows to come or have we reached a tilting point. My thesis looks at the bull case, with the engineered equal lows representing a trap play - both for excited early buyers and greeds bears.
LONG NIOflags everywhere, and its weird. it feels odd to repeat the same process but thats all the market does and it works...
t1 $4.20
t2 $5.00
opened $5 strikes in sept., glhf
NIO - Start of a major Breakout? | Ew analysisPersonally, I see only two realistic scenarios for NIO: either the major correction has already concluded, or we are very close to its completion. The scenario presented here appears the most compelling, as it allows for the possibility of a significant bullish impulse beginning to unfold toward the end of Q4 2025—potentially fueled by improved profitability prospects and the company's continued push toward long-term operational efficiency.
NIO – Breakout Approaching from Apexhi Traders
How are you today? Do you like NIO stock today?
The price of NIO is currently sitting right at the apex of a narrowing wedge, indicating that a decisive breakout is likely imminent. This technical formation has been building for months, and the price has now tightened into a point where volatility and direction are expected to return soon.
The RSI (Relative Strength Index) is showing bullish signs, with an upsloping structure despite the sideways price action, which suggests growing bullish momentum under the surface. This hidden strength adds confidence to a potential bullish breakout.
We’ve identified two key upside targets for the bulls:
🎯 Target 1: $5.24 — a 45% move from current levels
🎯 Target 2: $7.70 — previous resistance and a major psychological level
However, on the flip side, if the price breaks down from this pattern instead of up, we could see NIO revisit levels as low as $2.20, which would delay the bullish scenario significantly and potentially extend the consolidation phase.
Summary:
🔺 At apex of wedge pattern — breakout expected soon
📈 RSI is bullish and rising, indicating potential strength
🎯 Bullish targets: $5.24 and $7.70
⚠️ Bearish breakdown risk: Downside to $2.20
Traders should watch for a confirmed breakout or breakdown before entering, as momentum can accelerate quickly once direction is established.

NIO INC ADR - Short Range Trend Line Breakout - Morgan StanleyNIO INC ADR - Short Range Trend Line Breakout - Morgan Stanley Overweight Rating reiterated with a prive Target of 5.80 USD with L90 ONVO about to Launch on Aug 1st. Will it continue the upside momentum or fade, fingers crossed..
$NIO Breakout play- NYSE:NIO breakout play.
- I have marked the potential levels.
- NYSE:NIO moon time!
Safe Entry Zone NIOGreen Zone Is Safe Entry and Retest before exploding higher.
Note: 1- Potentional of Strong Buying Zone:
We have two scenarios must happen at The Mentioned Zone:
Scenarios One: strong buying volume with reversal Candle.
Scenarios Two: Fake Break-Out of The Buying Zone.
Both indicate buyers stepping in strongly. NEVER Join in unless one showed up.
2- How to Buy Stock:
On 15M TF when Marubozu Candle show up which indicate strong buyers stepping-in.
Buy on 0.5 Fibo Level of the Marubozu Candle, because price will always and always re-test the imbalance.

NIO CHART UPDATETRENDS AND PRICE TARGETS MARKED
GAPS IN YELLOW
Guideline in yellow.
Watch the two major trends closely, (RED)
short term trends going down are about to break.
Red trends will become support when price crosses over and confirms the Daily.
Good luck!

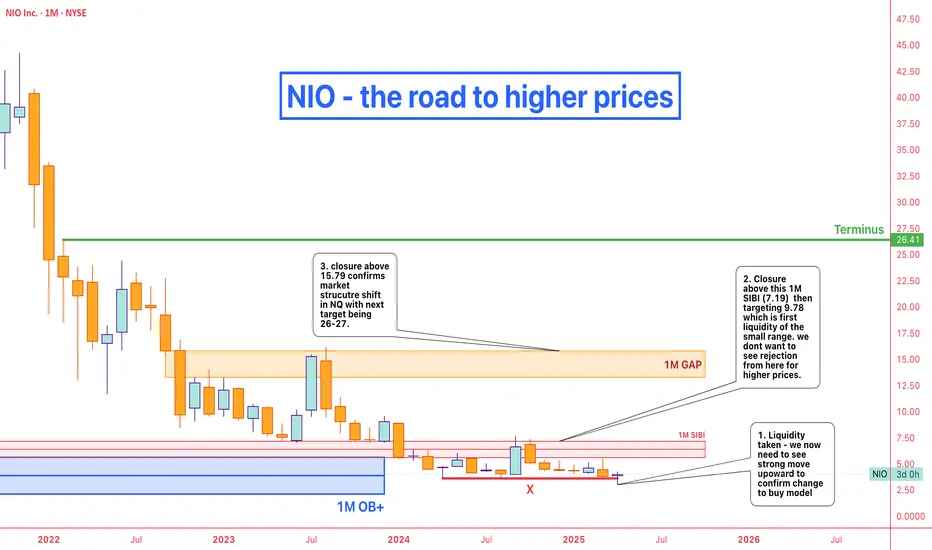
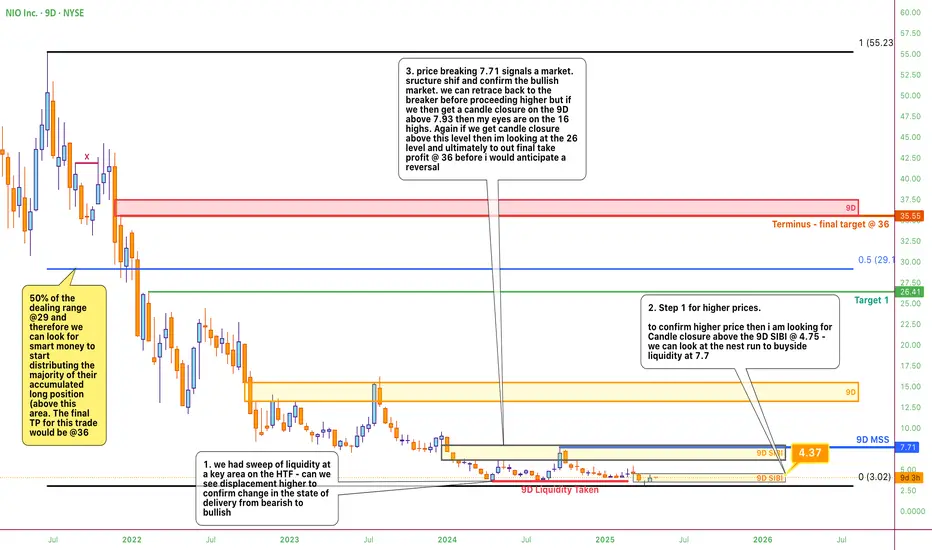
NIO - The Bullish RoadThere is a long road to go to see any bullishness in NIO. This diagram is a simple annotation of the steps for higher prices and bullishness on NIO. Right now we might be seeing the beginning of a shift to bullishness if we star displacing higher and price signatures such as bullish fair value gaps left open would help strengthen the bullish bias.

NIO - Clear Skies AheadFor those looking to invest in Nio or already invested and praying on a better sky - the bullish way is predicated on price following the road i have outlined on the chart. We are at an area of price where we can start to see institutional players step in now after accumulating very cheap positions in what is in my opinion one of the outstanding EV companies in the world.

NIO NIO NIO i want to see blue skiesFor long term investors who want to get beyond the riffraff of technical prices analysis and scribbled charts- look no further - a simple and clear read on NIOs road to higher prices. If we get a candle closure on the 3M candle above 7, then we can look for the 24.5 target.
Keep safe and for us NIO lovers - hopefully there are bluer skies ahead- imminently on the pending financials.

NIO - The side road to higher pricesIs NIO going higher and if so when? Technical analysis and fundamental analysis and any type of analysis may be proving more confusing the longer you have followed this company and so I hope this chart provides you with a clear view of atleast what is required in the short term to start the trek higher - until we see these signatures in price as of now the orderflow is still bearish (and no this does not mean to short in what is a heavily undervalued stock IMO) at prices institutional investors are picking up their long position.
If this chart provides you any value or you have a different view then please leave a comment

NIO - Beyond the confusion, the road to success is clear this simple charts aims to simplify what to look for in higher NIO prices.
Is Nio’s ambition outpacing reality?Chinese electric vehicle maker Nio faces significant challenges despite strategic efforts like the recent launch of the Firefly brand. A successful and innovative company known for its battery swaps, Nio is now grappling with increasing domestic competition, slowing economic growth, and significant financial losses reflected in its low share price and market cap. The company’s path forward, and particularly its ambitious global expansion, increasingly appears fraught with external pressures and technological hurdles that threaten its long-term viability.
Chief among these challenges is rising geopolitical risks. Rising trade tensions between major global powers, including potential tariffs from the US and Europe, directly threaten Nio’s access to the international market and its growth prospects. More critically, the unresolved situation regarding Taiwan poses a serious risk of conflict (a Chinese invasion of Taiwan) and subsequent international embargoes. Such a scenario could disrupt global supply chains, especially for critical components such as semiconductors essential for electric vehicles, and cripple Nio’s production and sales.
Furthermore, Nio is in an expensive technological arms race, particularly in autonomous driving, competing with global leaders such as Tesla. While Nio uses a multi-sensor approach with LiDAR in its Navigate on Pilot Plus (NOP+) system, Tesla’s vision-only strategy and extensive data collection pose a formidable challenge. Both companies face obstacles, and with the complex task of perfecting autonomous technology in diverse environments, Nio must not only adapt to technological advances but also navigate complex regulatory landscapes and execute flawlessly to compete effectively and justify its significant investments in this space.
An Important Bullish Pattern Forms on the NIO Share Price ChartAn Important Bullish Pattern Forms on the NIO Share Price Chart
Today, the share price of NIO Inc. (NIO), a Chinese manufacturer of "smart" electric vehicles, is trading above $4 – a development that may be viewed as an optimistic scenario following the drop to $3 in the first half of April, marking the lowest level in nearly five years.
Why Has NIO’s Share Price Risen?
Bullish sentiment has been supported by news that the company: → increased vehicle deliveries by 40.1% compared to the same period last year; → is launching its premium ET9 model, expanding its range of offerings.
Additionally, news offering hope that high tariffs in international trade may not hinder the company's growth has also had a positive impact on NIO’s share price.
Technical Analysis of NIO’s Share Price Chart
From the perspective of candlestick analysis on the daily chart, a "Three White Soldiers" pattern (marked with an arrow) can be observed. This is considered an important bullish signal, as according to Thomas Bulkowski, author of Encyclopedia of Candlestick Charts, following the formation of a "Three White Soldiers" pattern, a bearish trend (highlighted by the red channel) reverses to the upside in 82% of cases.
However, it is important to bear in mind that resistance may be encountered at:
→ the $4 per share level, as it previously served as a support;
→ the 50% Fibonacci retracement level from the downward move between 12 March and 8 April.
This article represents the opinion of the Companies operating under the FXOpen brand only. It is not to be construed as an offer, solicitation, or recommendation with respect to products and services provided by the Companies operating under the FXOpen brand, nor is it to be considered financial advice.

NIO - the long playThere is a long road to go to see any bullishness in NIO. This diagram is a simple annotation of the steps for higher prices and bullishness on NIO. Right now we might be seeing the beginning of a shift to bullishness if we star displacing higher and price signatures such as bullish fair value gaps left open would help strengthen the bullish bias.

NIO the road to higher pricesThere is a long road to go to see any bullishness in NIO. This diagram is a simple annotation of the steps for higher prices and bullishness on NIO. Right now we might be seeing the beginning of a shift to bullishness if we star displacing higher and price signatures such as bullish fair value gaps left open would help strengthen the bullish bias.