Wedge on NikeA wedge pattern was formed on the 1 hour timeframe. If the price manages to break through the support level of 85.97-87.32$, I expect a further fall.
NKED trade ideas

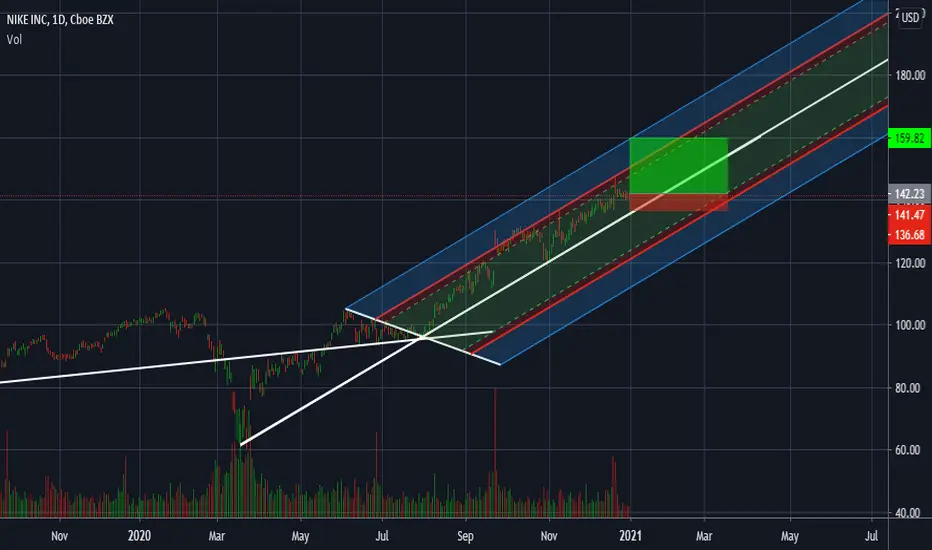
Nike bearish swing to $116.22One of the limits for the year has been triggered by this stock so I am short the stock.
I typically close instruments based on weekly close so a weekly close above $144.33 is my reason to close and potentially switch sides.
This trade will be held for weeks once it goes into profit.
I got filled at $140 with a SL of $148.00 with a target of $116.22
This is for entertainment purposes only.
Trading come with risk and you should consult a financial advisor for financial advice.


NKE over 143.05Looking at past price action, it tends to bounce ~7% after hitting the 34-50EMA cloud. We'll see if this type of analysis proves accurate. That lines up with this fib extension at 149.48, giving us a nice upside target. Entry point is drawn based on recent price action.

NKE Bouncing Support Towards ATHRetesting previous all time highs and bouncing from the current support levels, NKE is well on it's way to new all time highs next week.

Nike go higherTrade what I'm see..but still waiting on breakout
Entry Point : 141.40
TP 1 : 154.07
TP 2 : 165.14
TP 3 : 184.88
SL : 131.22

LONG NKEprob a gentle pull back and continue with this uptrend
sell some puts aimed at the bottom of the channel
not a bad idea to get assigned shares to take for capital appreciation


nike daily analysisHi friends
the daily chart of this market shows with a high probability that the first goal will be the level of and if there will be a breakout at this level the second goal will be the level


$NKE with a bullish outlook following earning releaseThe PEAD projected a bullish outlook for $NKE after a positive over reaction following its earnings release placing the stock in Drift B
If you would like to see the Drift for another stock please message us. Also click on the Like Button if this was useful and follow us or join us.

IRON TARIHi guys!
New Iron condor, check my last trades, and get my script for free!
Enjoy your wallet!
Tari.

Nike earnings have serious potential to set a course.As seen in this 4 hr chart, Nike has been in an ascending channel since the corona sell off/rebound. The price action has moved in accordance with the upward parallel channel it is seemingly advancing in. It has recently slowed down and failed to rise back above the midline of the channel recently. Heres the tricky part, Nikes recent sell off leaves this one in the middle of a grey area territory. The chart setup is perfect for a BIG move around earnings, which way is very much so up in the air. As previously stated this one falls right in the middle of the current gray area, RSI is nearing oversold, but if there is no RSI support around the 40/50 area, and an increase in selling volume, this one could have lost steam, change course, and fall into a bearish channel downwards back towards 105. Nike earnings and the investors reaction to said earnings, have the possibility to set this one on a path that it could possibly take into the end of the year.
(*personal advice: always play earning safely with a neutral strategy*)
Bullish (possible by end of year) price target:$140
Bearish (possible by end of year) price target:$105
Earnings could set the future course for Nike.

Short Nike going into earningsI've built a case to show why Nike could be making a long term top, and this earnings could be the catalyst for the turn around.
Thank you for your constructive feedback !

"Just Do It" ® Nike earnings at 4:15pm 12/18 Quadruple Witching"Just Do It" ® NKE earnings at 4:15pm 12/18 Quadruple Witching. Nike is the world's leading designer, marketer and distributor of authentic athletic footwear, apparel, equipment and accessories for a wide variety of sports and fitness activities. I'm leaning towards an earnings beat, but you never know how the market reacts to earnings, especially tomorrow is Quadruple Witching, market index futures, market index options, stock options and stock futures expire, usually resulting in increased volatility.
2nd Quarter November 2020
Consensus: $0.62
Revenue: $10.59 Billion
Possible neutral strategy is to short an ironfly & buy a far otm strangle
sell $140 call 12/24, Delta = .53, Theta = .31
sell $140 put 12/24, Delta = .47, Theta = .31
buy $148 call 12/24, Delta = .27, Theta = .27
buy $132 put 12/24, Delta = .20, Theta = .21
credit = $560 , risk $230, reward $800
+
buy $155 call 12/24, Delta = .13, Theta = .19
buy $130 put 12/24, Delta = .15, Theta = .18
cost = $165 max risk, reward $+
=
$395 opening trade / risk, reward $800+
Possible aggressive neutral strategy is to buy a strangle
$142 call 12/24 = $370, Delta = .46, Theta = .31
$140 put 12/24 = $410, Delta = .47, Theta = .31
=
$780 opening trade / risk, reward $+++
Do your own due diligence, your risk is 100% your responsibility. You win some or you learn some. Consider being charitable with some of your profit to help humankind. Small incremental steps work : If you double a penny / day for a month it = $5,368,709. Good luck and happy trading friends...
*3x lucky 7s of trading*
7pt Trading compass:
Price action, entry/exit
Volume average/direction
Trend, patterns, momentum
Newsworthy current events
Revenue
Earnings
Balance sheet
7 Common mistakes:
+5% portfolio trades, risk management
Beware of analysts motives
Emotions & Opinions
FOMO : bad timing
Lack of planning & discipline
Forgetting restraint
Obdurate repetitive errors, no adaptation
7 Important tools:
Trading View app!, Brokerage UI
Accurate indicators & settings
Wide screen monitor/s
Trading log (pencil & graph paper)
Big organized desk
Reading books, playing chess
Sorted watch-list
Checkout my indicators:
Fibonacci VIP - volume
Fibonacci MA7 - price
pi RSI - trend momentum
www.tradingview.com

NKE - Nike Earnings Trade - ButterflyNKE - Nike Earnings Trade - Butterfly
What do you think about this Butterly Options Strategy?
The legs are 10 points wide and as long as it stays within range, we're OK.
But.. who knows? NIKE popped last earnings. What will it do this time?

NIKE LONG SWING POSITION BUY ! JORDANS KEEP JUMPING OFF SHELVESNIKE IS EXPECTED TO REACH $170-$180 by the end of 2021 or sooner
Earnings report coming in on Friday
I’m swing buying Nike long !
TP’s
170
180
225
My entry price is around $136!

NKE - December 12, 2020NKE reports earnings on December 18th after market close. EPS forecasts are $0.61 down from the reported $0.7 last quarter. With strong demand for online sales and a recent surge in the stock's price to a new $140.45 ATH, look for NKE to surge in the lead up to earnings. The strength of the brand's international presence could drive a significant earnings beat this quarter. Good RR setup here on this trade.

NKE Stock High Probability Long To 180$According to my analysis I recommend to keep as much as possible nike stock in portfolio because we have a high probability that we can reach 170$ and even 180$ in the next few months.

Elliott Wave View: Nike (NKE) Extending to New All-Time HighShort term Elliott Wave View view in Nike (ticker symbol: NKE) suggests the rally from October 30 low is unfolding as a 5 waves impulse Elliott Wave structure. Up from October 30 low, wave (1) ended at 139.09 and pullback in wave (2) ended at 125.63. The stock has resumed higher in wave (3) which is unfolding in another 5 waves in lesser degree.
Up from wave (2) low at 125.61, wave ((i)) ended at 133.98 and dips in wave ((ii)) ended at 128.43. The stock then resumed higher in wave ((iii)) towards 139 and pullback in wave ((iv)) ended at 132.69. Expect wave ((v)) to end soon and this should complete wave 1 of (3) in larger degree. Afterwards, stock should pullback in wave 2 to correct cycle from November 13 low before the rally resumes.
As far as wave (2) low pivot at 125.61 low stays intact, expect pullback to find support in the sequence of 3, 7, or 11 swing for further upside. Minimum potential target higher is 100% – 123.6% fibonacci extension from October 30 low towards 145.76 – 150.48. A 161.8% extension in wave (3) is possible which should bring the stock to 158.14.

