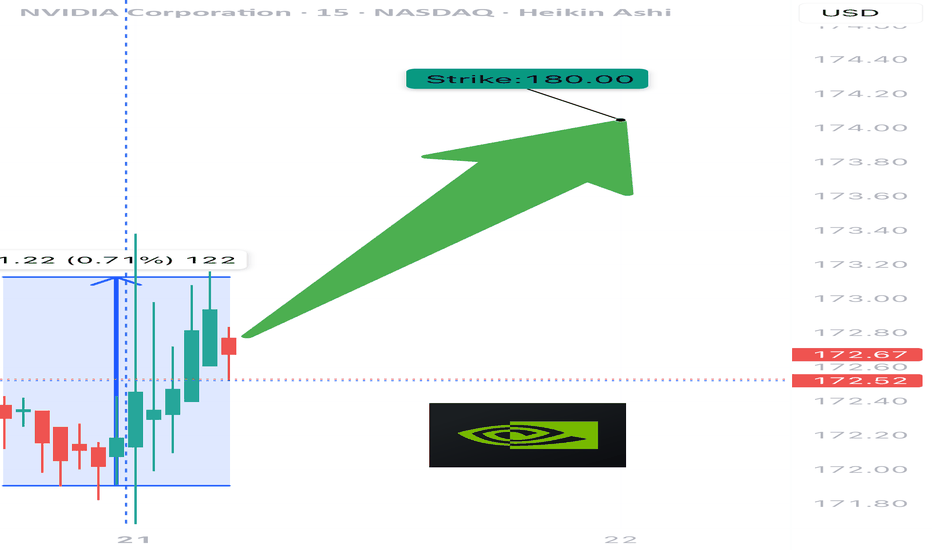
$NVDA WEEKLY TRADE IDEA – JULY 21, 2025
💥 NASDAQ:NVDA WEEKLY TRADE IDEA – JULY 21, 2025 💥
🔥 Bullish Options Flow + Weekly RSI Strength = Controlled Momentum Play
⸻
📊 Trade Details
🔹 Type: Long Call
🎯 Strike: $180.00
📆 Expiry: July 25, 2025 (4DTE)
💰 Entry: $0.51
🎯 Target: $1.02 (💯% Gain)
🛑 Stop: $0.20 (~40% Risk)
📈 Confidence: 65%
🕰️ Timing: Monday Open
📦 Size: 1 Contract (Adjust based on risk tolerance)
⸻
📈 Why This Trade?
✅ Call/Put Ratio = 1.48 → Bullish bias confirmed
📈 Weekly RSI = 77.0 → Strong momentum
🔻 Daily RSI = 80.8 (falling) → Short-term pullback risk
📉 Volume = flat (1.0x) → Weak confirmation = tighter risk mgmt
🧠 Strike Clustering: $177.50 & $180 = strong OI zones
🌬️ VIX = 16.7 → Favorable for long premium plays
⸻
⚠️ Risks & Strategy Notes
❗ Daily RSI = caution: short-term exhaustion possible
📉 Weak volume = lack of institutional chase
⏳ Exit before Friday – avoid IV crush and gamma slam
🔐 Set alerts at $178.75 and $179.80 – pre-breakout signals
⸻
🎯 Plan:
• Enter Monday open
• Scale partials if price hits +30–50%
• Full exit by Thursday unless price is breaking through $180 early with strong volume
⸻
🏁 Quick Verdict:
This is a momentum continuation setup, not a fresh breakout.
Play the trend, respect RSI signals, and cut fast if flow dries up.
NASDAQ:NVDA 180C — Risk $0.20 to Target $1.02
Let the call ride… just don’t overstay.
⸻
#NVDA #OptionsTrading #CallOption #WeeklyPlay #MomentumTrade #FlowBasedSetup #TradingViewIdeas #GammaPlay #BullishBias #NVIDIA
NVDA trade ideas
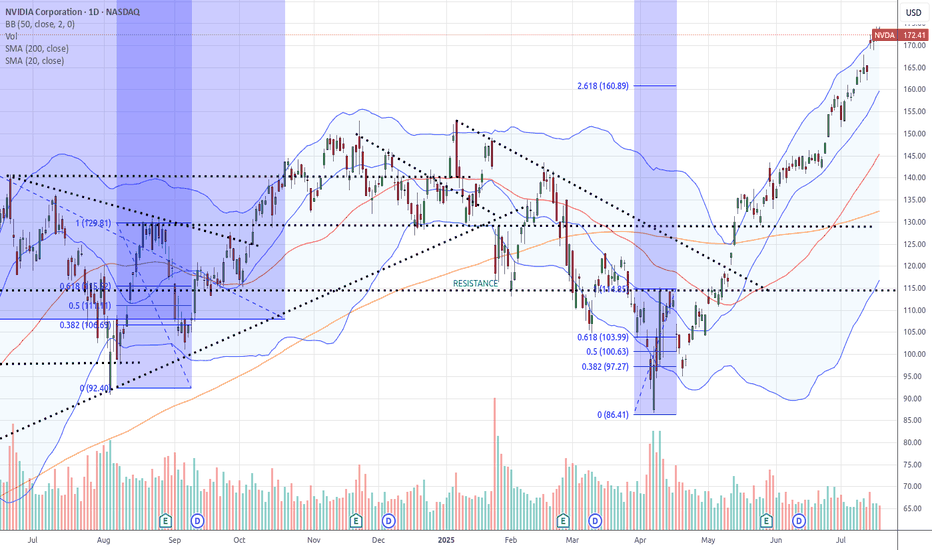
Is it finally time for a rally?Looking at NVIDIA (NVDA) on the weekly chart over the past two years, a significant gap up becomes apparent around April, which persisted for much of the year. Considering the recent news and the stock's pullbacks lately, this may be the moment for NVDA to resume its upward grind. The coming weeks will reveal its direction.
Additionally, it's worth noting the formation of a massive bull pennant on the weekly chart. If history repeats itself and this pattern holds, the next 2 to 6 weeks could prove to be a thrilling period for NVDA.
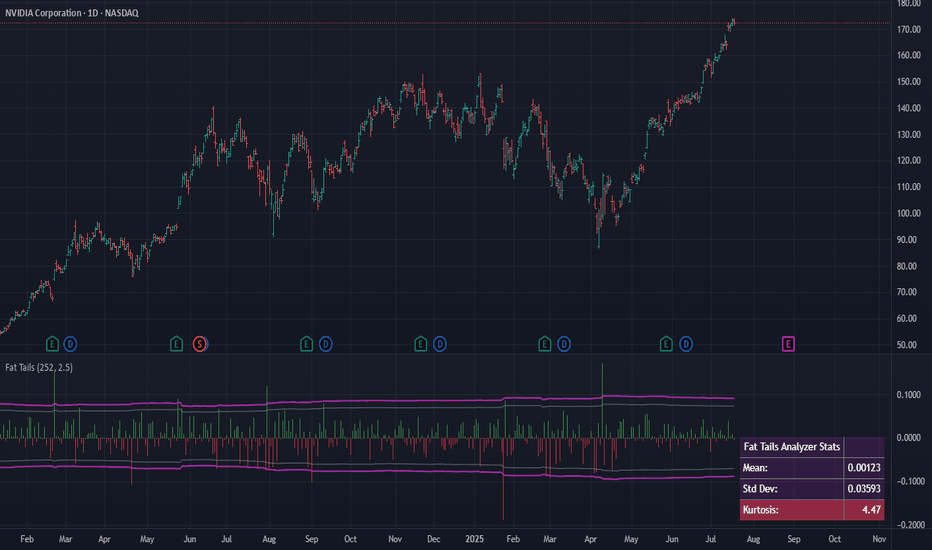
Fat Tails: Why Mean Reversion is a Rarity in Financial MarketsIn financial markets, volatility is a measure of how much asset prices change over time. Traditionally, finance assumes that asset returns fit neatly into a "bell-shaped" normal distribution curve. This implies that prices usually stay close to their average, and extreme surges or drops (beyond three standard deviations) are very rare, with approximately a 0.3% probability. However, reality consistently refutes these expectations, showing that powerful fluctuations occur much more frequently in markets. This is the phenomenon of "fat tails".
What are "Fat Tails"?
"Fat tails" occur when the probability of large price changes (up or down) is significantly higher than predicted by a normal distribution. Instead of a neat "bell-shaped" curve, we see distributions with "thick tails," like Lévy, Pareto, or Cauchy distributions. Such distributions are characterized by "excess kurtosis" (kurtosis > 3). Kurtosis is a statistical measure that shows the "peakedness" of a distribution and the "thickness of its tails." If kurtosis > 3, the tails are "heavier" than those of a normal distribution, and the peak is often higher—meaning that small deviations from the mean also occur more frequently, but extreme events are not as rare as they seem. These distributions better describe how markets behave, especially volatile ones like cryptocurrencies, where extreme movements happen 5-10 times more frequently than normal distribution models would predict.
For example, in October 1987 (Black Monday), the Dow Jones index plummeted by 22% in a single day—an event that a normal distribution would estimate as practically impossible. In 2020, WTI crude oil prices turned negative (–$40 per barrel), which also doesn't fit standard models. And Bitcoin, throughout its history, has repeatedly shown daily movements of ±20%, which is 50–100 times more frequent than a Gaussian distribution would predict.
Imagine two graphs:
Gaussian Bell Curve (Normal Distribution): Most events fall within ±3σ, and extremes are almost imperceptible.
Fat-Tailed Distribution (e.g., Pareto): The "tails" are thick, and rare events (like crises) stand out like icebergs.
These cases illustrate why classical risk models like VaR often fail. Let's explore how science attempts to address this problem.
What Does This Mean for Risk?
"Fat tails" change the rules of the game for risk management. Nassim Taleb, a prominent voice on this topic, argues that they invalidate conventional methods of financial analysis. Standard estimates of the mean, variance, and typical outliers of financial returns become unreliable. Models like VaR (Value at Risk), which rely on a normal distribution, often underestimate how badly things can go wrong. They are simply unprepared for "black swans"—rare but devastating events that can crash the market. As Taleb stated, "ruin is more likely to come from a single extreme event than from a series of bad episodes".
"Tail risk" is when an asset or portfolio experiences a significant change in value (more than three standard deviations from its current price) due to an unusual and unexpected event. Such events not only impact prices but can also trigger panic, liquidity issues, and spill over into other markets.
Although "fat tails" seem obvious, some economists (e.g., proponents of the efficient market hypothesis) argue that extreme events are merely rare but explainable deviations. They contend that if all factors (geopolitics, liquidity changes) are properly accounted for, the distribution isn't as "heavy-tailed" as it appears. However, the crises of 2008 and 2020 demonstrated that even the most sophisticated models often underestimate tail risk.
How Does Science Address "Fat Tails"?
To grapple with these tails, researchers have developed several approaches:
Extreme Value Theory (EVT): This method focuses specifically on the "tails" of the distribution to better predict extreme events. EVT helps to more accurately estimate risks and VaR, especially when a normal distribution clearly doesn't apply, and data more closely resembles Fréchet or Pareto distributions.
Jump-Diffusion Models: These models explicitly incorporate sudden, discontinuous price changes, or "jumps," in addition to continuous diffusion movements. Robert Merton, as early as 1976, proposed combining smooth price movements with Poisson jumps to better describe the market. Jumps are interpreted as "abnormal" price variations caused by important news or systemic shocks.
Intraday Data Analysis: Barndorff-Nielsen and Shephard (2004) developed a method to decompose total price variation into a continuous component and a jump component using high-frequency data. This helps to more accurately forecast how much the market can fluctuate.
GARCH Models: These models capture "volatility clustering"—the tendency for periods of high volatility to be followed by more high volatility, and periods of calm by more calm.
But if "fat tails" are so prevalent, why do many still believe in "mean reversion"? Here's the catch...
Why Mean Reversion Doesn't Work
The idea of "mean reversion" is that asset prices or returns will eventually revert to their long-term average. It's popular in finance, but with "fat tails," it's not so simple:
Unstable Mean: In markets with "fat tails," the "mean" itself is constantly shifting. If the average value is unstable, then talking about reverting to it becomes less predictable and meaningful. Moreover, in such distributions, the sample mean often doesn't align with the theoretical mean.
Extreme Events Dominate: A single powerful fluctuation can turn everything upside down. Instead of "returning to normal," the market can enter a new regime of high volatility for an extended period.
Jumps Are Not Just Noise: Significant price changes due to news or shocks are not temporary outliers that can be easily smoothed out. They represent serious risks that cannot simply be waited out.
Volatility Clustering: Markets tend to "get stuck" in periods of high or low fluctuations. After a strong move, the market may not calm down but continue to fluctuate, which breaks the idea of mean reversion. Interestingly, "fat tails" arise not only from fundamental reasons but also from irrational crowd behavior. When the market falls, investors massively sell assets, exacerbating the crisis (a positive feedback effect). This explains why tails are "heavier" in cryptocurrencies—there are more speculators and fewer institutional players stabilizing the market.
Conclusion
Mean reversion works only in "calm" times when the market behaves predictably. But in reality, "fat tails" and powerful fluctuations are not rare, but a part of financial market life. To cope with this unpredictability, more sophisticated models and risk approaches are needed. Understanding "fat tails" is key to managing risks in the chaotic financial world.
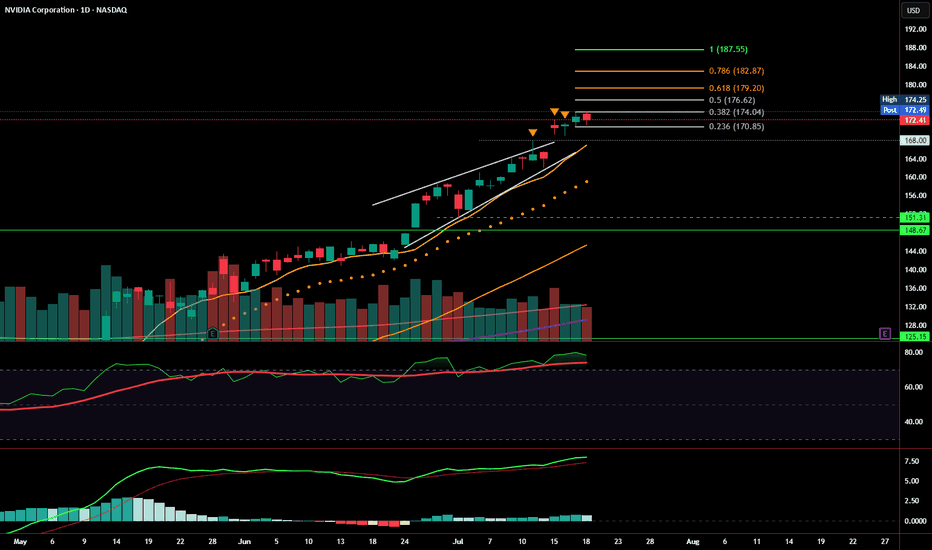
Weekly Close: Still Bullish, But Momentum Is SlowingNVDA closed the week at $172.41, just under short-term resistance and holding well above the prior rising wedge structure. Price action remains technically bullish, with a healthy consolidation forming just below the 0.382 Fibonacci retracement at $174.04.
That said, momentum is beginning to cool, and the next few sessions will be key.
📊 Current Read: Mildly Bullish
Price is holding above key support levels: 9 EMA, $170.85, and prior wedge resistance
No breakdowns — structure remains intact
However, volume is fading, and MACD is flattening, suggesting possible buyer fatigue
RSI remains elevated, not yet signaling reversal, but approaching caution territory
A confirmed breakout above $174.25 sets the stage for Fibonacci targets at:
🔸 $176.62, $179.20, $182.87, and $187.55
A close below $170.85 , and especially $168, would invalidate the current bullish structure and shift bias to bearish — targeting the $151.31–148.67 support zone.
Summary:
📈 Bias: Bullish - but cautious.
Price is consolidating near highs with no signs of breakdown yet. Continuation likely if bulls step in early next week.
NVDA HAGIA SOPHIA!The Hagia Sophia pattern has now fully formed; it just needs the crack! and the Hook!
No matter what your vague hunches and feelings are about AI, the charts will always win.
You can't "buy the dip" unless you know when to "Sell the Rip"!
If you can't see this resistance area, I don't know what to tell you.
Everyone is bullish at the top of a bubbliotious market without exception!
Click boost, Like, Subscribe! Let's get to 5,000 followers. ))
NVDA Nearing it's top, When to Buy in?Hi, I’m The Cafe Trader.
This week we’re continuing our breakdown of the MAG 7, and today we’re taking a look at NVIDIA (NVDA) — 2 out of 7 in the group have broken out to new all-time highs, and NVDA is one of them.
⸻
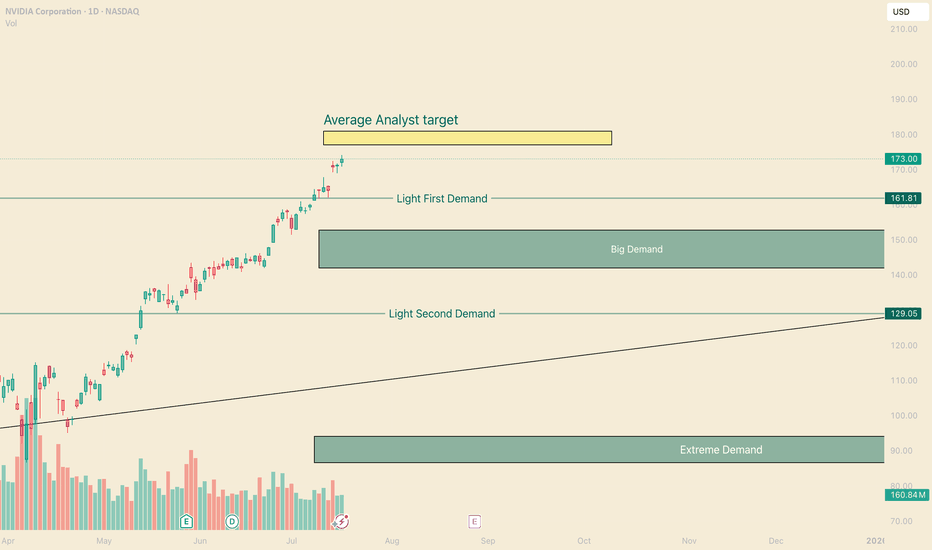
🧠 Analyst Targets
Analyst price targets for NVDA are wide-ranging — some as low as $80, others as high as $250.
The average target is around $180, and NVDA is currently approaching that level.
Buying into strength like this can be difficult, so I’ve prepared a few long-term price zones for those looking to add on dips.
⸻
📈 Long-Term Price Zones to Watch:
• Aggressive Entry Zone: ~$163
This is the top of a developing demand zone. You’ll see some buyer interest here, but that demand extends down toward $144.
• Primary Demand Area: $153–$144
This is where stronger buyers have shown up in the past. It’s a more balanced zone and could act as a key support in any retracement.
• Deep Value Zone: ~$129
If NVDA pulls back this far, this would be my favorite buy level. Anything at $130 or lower would represent what I consider a steal — strong value relative to long-term expectations.
⸻
📊 Follow for more MAG 7 price breakdowns.
Up next: a deeper dive into NVDA for shorter-term swing trades and technical setups.
📍@thecafetrader
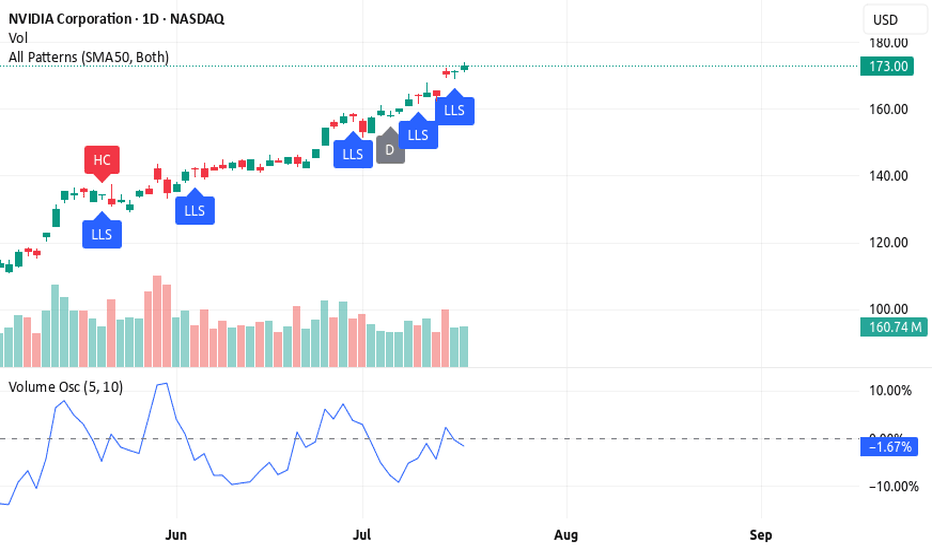
3 Reasons Why Nvidia (NVDA) Looks Bullish Right Now🚀 3 Reasons Why Nvidia (NVDA) Looks Bullish Right Now
Nvidia is showing strong signs of a bullish breakout. Here are 3 solid technical reasons why NVDA could be ready to lift off 📈
1️⃣ Candlestick pattern – long lower shadow
The long lower shadow signals buyers stepped in after early selling pressure. This shows strong demand at lower prices — classic bullish behavior.
2️⃣ High daily volume
Nvidia is trading on increased volume today, confirming that big players are active. High volume validates the price action and increases the reliability of the bullish setup.
3️⃣ Reversal on the volume oscillator
The volume oscillator is reversing from below zero, signaling momentum may be shifting back to the bulls. This indicates a potential trend change just before a new rally begins.
🔥 Bonus: Rocket Booster Strategy
NASDAQ:NVDA fits the Rocket Booster Strategy:
Price is above the 50 EMA
Price is above the 200 EMA
A recent gap up confirmed by candlestick support
When all these factors align, it’s like lighting the engines for a bullish liftoff.
Rocket boost this content to learn more
---
⚠️ Disclaimer: Always use a simulation (demo) account before trading with real money. Learn proper risk management and profit-taking strategies to protect your capital.
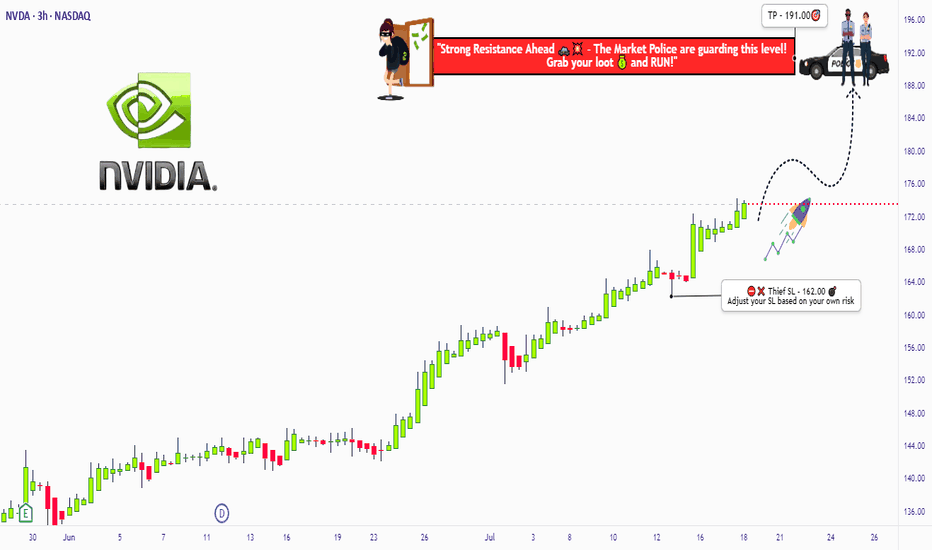
NVIDIA Robbery Plan: Bullish Swing Trade to Millions!🔥 NVIDIA (NVDA) Stock Heist Blueprint: Unlock Bullish Profits with Thief Trading Style! 🚀💰
🌟 Greetings, Wealth Warriors! 🌟
Hello, Ciao, Salaam, Bonjour, Hola, and Hallo to all you savvy traders and market masterminds! 🤑💸 Get ready to execute a high-octane trading plan with our Thief Trading Style—a bold fusion of technical precision and fundamental insights designed to crack the NVIDIA (NVDA) stock market vault! 💥📈
📝 The NVIDIA Heist Plan: Swing & Day Trading Mastery 🏆
Based on our proprietary Thief Trading Style, this plan targets NVIDIA (NVDA), currently riding a bullish wave fueled by strong fundamentals and technical setups. Follow the strategy outlined below to navigate the high-risk Red Zone—where overbought conditions, consolidation, and potential trend reversals create opportunities for sharp traders. 💪 Stay alert, as bearish players may set traps at key levels! 🕵️♂️
Entry Strategy: Crack the 🙂Vault! 🏦
Go long with confidence! The market is primed for a bullish breakout. Enter at current prices or set buy limit orders near recent swing lows/highs on the 15-minute or 30-minute timeframe. 📅
Pro Tip: Set price alerts on your chart to catch the optimal entry. Timing is everything in this heist! ⏰
Swing Traders: Look for pullbacks to key support levels for safer entries.
Scalpers: Focus on quick long-side trades with tight stops to maximize gains. 💨
Stop Loss: Protect Your Loot! 🔒
Place your stop loss (SL) below the recent swing low on the 30-minute timeframe (e.g., $162.00 for swing trades).
Adjust your SL based on your risk tolerance, position size, and number of orders. For larger accounts, consider tighter stops to lock in gains early. 🛡️
Scalpers: Use a trailing stop to secure profits while riding short-term momentum.
Take Profit Target: Cash Out Big! 💰
Aim for $191.00 as the primary target, or exit early if momentum slows.
Swing Traders: Hold for the full target if the trend remains strong.
Scalpers: Grab quick profits on smaller price spikes and re-enter on dips.
Pro Move: Use a trailing stop to let profits run while safeguarding gains. 🚀
📌Key Levels & Risk Management
Entry Zone: Market price or swing low – ideal for long positions. 📈
Stop Loss: $162.00 – based on 30m timeframe swing low. 🛑
Take Profit Target: $191.00 – primary target for swing/day trades. 🎯
Risky Red Zone: Overbought levels – watch for consolidation or reversal traps. ⚠️
💡 Why NVIDIA? The Bullish Case 📡
NVIDIA (NVDA) is powering through a bullish phase, driven by:
Fundamentals: Strong demand for AI, gaming, and data center chips. 📊
Macro Factors: Positive market sentiment and tech sector momentum. 🌍
COT Data (Latest Friday Update, UTC+1): Large speculators are increasing bullish positions, signaling confidence in NVDA’s upside (data sourced from reliable platforms). 📅
Geopolitical & News: Monitor upcoming earnings and industry developments for catalysts. 📰
Intermarket Analysis: Tech-heavy indices like the NASDAQ are trending higher, supporting NVDA’s rally. 📈
For a deeper dive, check fundamental reports, COT data, and sentiment analysis to align your trades with the bigger picture. 🔍
⚠️ Trading Alert: Navigate News & Volatility 🗞️
News releases can spark sharp price swings. To protect your capital:
Avoid new trades during major news events (e.g., earnings or Fed announcements). 🚫
Use trailing stops to lock in profits and limit downside risk. 🔐
Stay updated with real-time market developments to adjust your strategy dynamically. 📡
🚀 Boost the Heist! Support the Thief Trading Community 🤝
Love this plan? Hit the Boost Button to amplify our Thief Trading Style and empower our community to conquer the markets! 💥 Every like and share fuels our mission to make money with precision and style. 💪 Join us daily to unlock more high-profit heist plans! 🏴☠️
📌 Important Disclaimer
This analysis is for educational purposes only and not personalized investment advice. Always conduct your own research, assess your risk tolerance, and verify market conditions before trading. Markets move fast—stay sharp and adapt! ⚡
🌟 Stay tuned for the next heist plan, traders! Let’s keep stealing profits together! 🤑🐱👤🎉
THRIVING IN CHAOSAs elections draws near, the result/outcome will definitely affect the financial market so WHY WILL NVIDIA GROW EVEN WITH THE WW3 LOOMING?
1.NVIDIA is the leaser in the artificial intelligence(AI) and data centre industries, largely due its cutting edge GPUS. These GPUs are essential for training large AI models like OpenAI's GBT series and other machine learning systems.
2.The company's AI- focused hardware, particularly the H100 GPUs ,is essential for training deep learning models ,autofocus vehicles and cloud based AI system
3.NVIDIA is branching into automotive AI and autofocus driving technology, partnering with companies like Mercedes and other automakers to provide the computing power needed for autonomous vehicles.
4.This company has has seen enormous growth in its data centre segment, which now contributes significantly to its revenue
6.The company has made strategic acquisitions, such as MELLANOX, which expanded its data centre and networking capabilities
AS TECHNOLOGY CONTINUE TO EVOLVE ,NVIDIA WILL BE THE CENTRE OF ATTENTION. LONG TERM BUY
There is a bullish structure that has been formed( w pattern) inside a bullish triangle showing a continuation bull movement/mometum coming . good luck on the longs
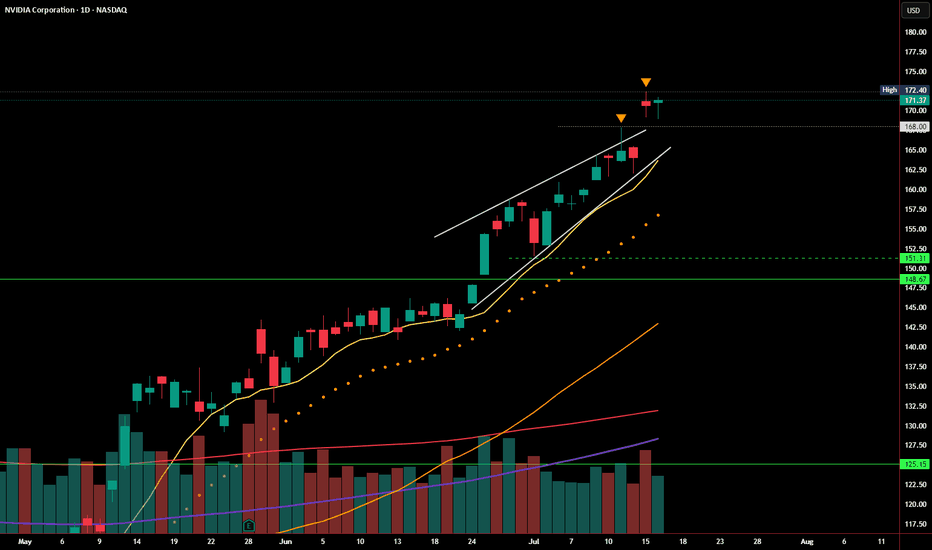
NVDA Follow-Up: Breakout Holding, But Still on Thin IceIn yesterday’s post, I highlighted the rising wedge pattern and noted that a breakout above $168 needed strong follow-through to confirm. Today, NVDA managed to hold above that level, closing at $171.37, just beneath the recent high of $172.40.
So far, the breakout attempt is intact — but not yet convincing.
🔹 Volume came in lighter, suggesting buyers aren’t fully committed
🔹 The candle printed a modest gain, but without expanding range or momentum
🔹 Price is still riding above the rising wedge, but hasn’t cleared resistance with authority
As long as NVDA stays above $168, bulls remain in control — but a daily close back below that level would re-enter the wedge and raise the risk of a false breakout, putting $151–148 back on the radar.
Until we see a strong breakout above $172.40 with volume, this remains a cautious breakout, not a confirmed one.
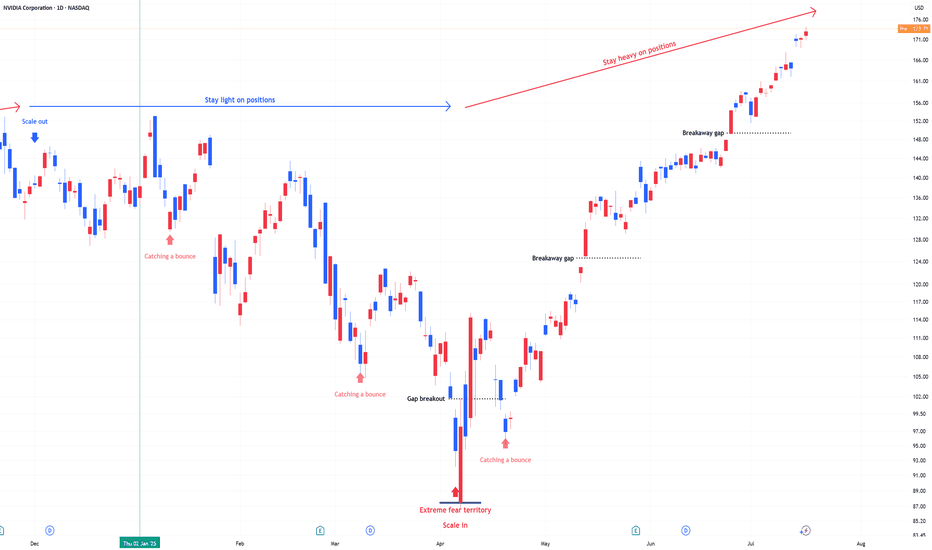
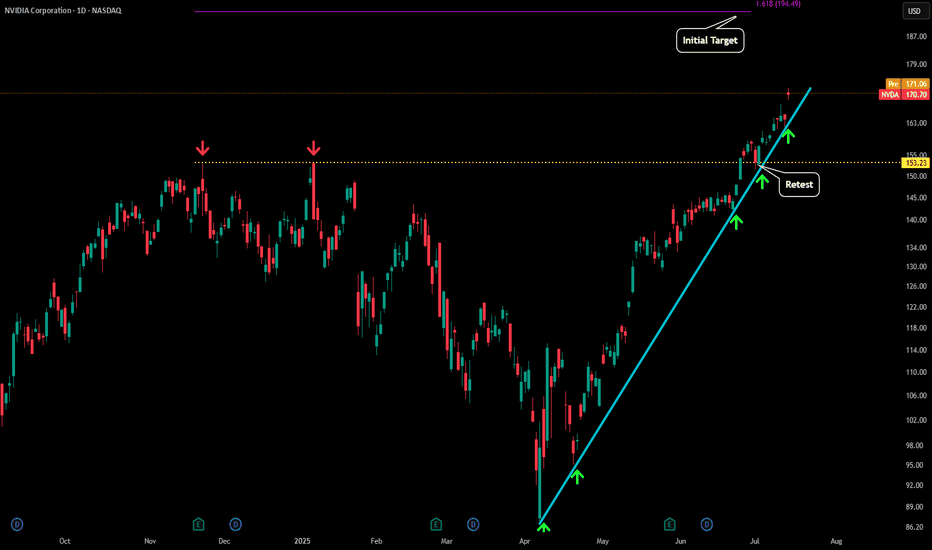
NVDA - Going VerticalNVDA has continue to see our near vertical trajectory to the upside.
After yesterday's test of our blue trendline on the daily at $160 price bounced and has now moved up to $170.
Due to the angle of this trend we will break to the downside very soon, but most likely not before some sort of blow off top move towards the $200 level. It is possible we continue to go vertical but just below $200 seems to be where the major level is to see some take profit start occurring.
Also market structure has been super strong which you can see by the retest and hold of the $153 level (yellow dotted line). This was the previous ATH that NVDA recently created as a new level of support with that retest.
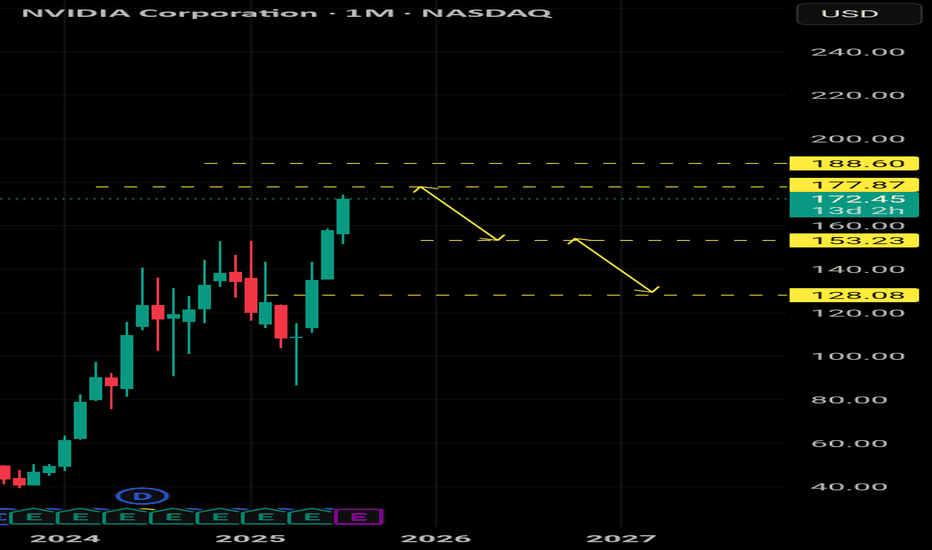
NVDA SELL SELL SELLSELL NVDA at any price now, riding it back down to 93.00 to 77.00 as Profit Targets, Stop Loss will be determine later!
If anyone likes long mumbo jumbo garbage analysis, than this is NOT for you.
Also, if you are afraid of risk, failure, and want only a 100% sure thing, than
run as fast as you can from the market, because the market is NOT a sure thing,
so it is definitely NOT for you.
WARNING: This is just opinions of the market and its only for journaling purpose. This information and any publication here are NOT meant to be, and do NOT constitute, financial, investment, trading, or other types of advice or recommendations. Trading any market instrument is a RISKY business, so do your own due diligence, and trade at your own risk. You can loose all of your money and much more.
NVDA SELLSELL NVDA at 149.00 to 163.00, riding it back down to 93.00 to 77.00 as Profit Targets, Stop Loss is at 172.00!
If anyone likes long mumbo jumbo garbage analysis, than this is NOT for you.
Also, if you are afraid of risk, failure, and want only a 100% sure thing, than
run as fast as you can from the markets, because the markets are NOT a sure thing,
so it is definitely NOT for you.
WARNING: This is just my opinions of the market and its only for journaling purpose. This information and any publication here are NOT meant to be, and do NOT constitute, financial, investment, trading, or other types of advice or recommendations. Trading any market instrument is a RISKY business, so do your own due diligence, and trade at your own risk. You can loose all of your money and much more.
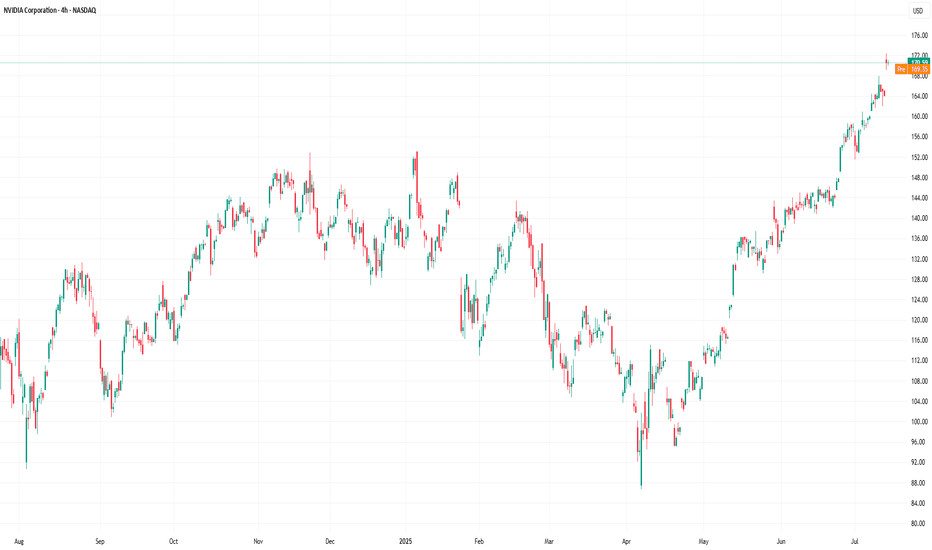
Nvidia (NVDA) Share Price Surges Above $170Nvidia (NVDA) Share Price Surges Above $170
Yesterday, Nvidia’s (NVDA) share price rose by more than 4%, with the following developments:
→ It surpassed the psychological level of $170 per share;
→ Reached another all-time high;
→ Gained more than 9% since the beginning of the month.
The bullish sentiment is driven by Nvidia CEO Jensen Huang’s visit to China shortly after meeting with US President Trump. At the same time:
→ US Secretary of Commerce Howard Lutnick stated that the planned resumption of sales of Nvidia H20 AI chips in China is part of the US negotiations on rare earth metals.
→ The head of Nvidia stated that he was assured licences would be granted very quickly, and that a large number of orders for H20 chip deliveries had already been received from Chinese companies.
Market participants are viewing the situation with strong optimism, and analysts are raising their valuations for NVDA shares:
→ Morningstar analysts raised their fair value estimate for Nvidia shares from $140 to $170.
→ Oppenheimer analysts increased their target price from $170 to $200.
Technical Analysis of the NVDA Chart
The price trajectory of NVDA shares fully reflects the exceptionally strong demand:
→ The price is moving within an ascending channel with a steep growth angle;
→ Since early May, the RSI indicator on the 4-hour chart has not fallen below the 50 level;
→ Yesterday’s trading session opened with a large bullish gap.
The chart also shows the formation of a stable bullish market structure (shown with a purple broken line), expressed through a sequence of higher highs and higher lows.
Given the above, it is difficult to imagine what might cause a sharp shift from positive to negative sentiment. If a correction begins (for example, with a test of the $160 level), traders should watch for signs of its completion — this could present an opportunity to join the emerging rally.
This article represents the opinion of the Companies operating under the FXOpen brand only. It is not to be construed as an offer, solicitation, or recommendation with respect to products and services provided by the Companies operating under the FXOpen brand, nor is it to be considered financial advice.
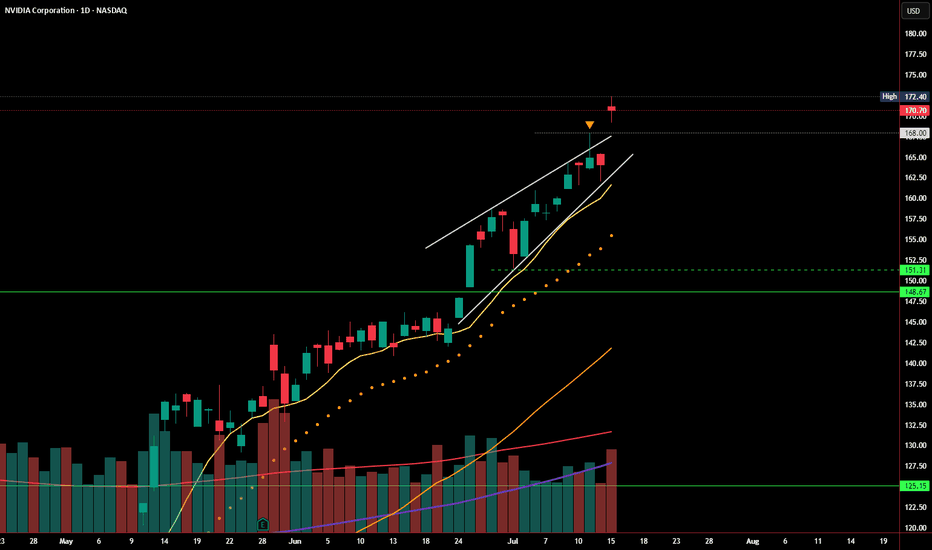
NVDA Update: Breakout Fading or Wedge Still in Play?In my last post, I highlighted the rising wedge pattern forming at the top of NVDA’s strong rally. Price briefly pushed above the upper wedge resistance and tagged $172.40, but today’s session printed a bearish close at $170.70 — just above the breakout level, but with no real follow-through.
Volume came in higher, but price action failed to extend the breakout, suggesting this could be a stall or even a false breakout in progress. RSI remains overbought, and momentum may be slowing despite the recent push.
If price slips back below $168, we could see the original wedge breakdown scenario come back into play. Watch for support around:
🔹 $151.31–148.67
🔹 Below that: $125 zone
For bulls, continuation above $172.40 with strong volume would invalidate this pattern and confirm breakout strength. Until then, caution is warranted.
NVIDIA -- Major Resistance // Confluence of 3 FactorsHello Traders!
WOW... This chart is quite incredible I must say.
It's amazing how price is currently at an exact point where 2 major trendlines converge which also nearly coincides with the 1.618 Fibonacci extension. Price closed almost to the penny just above the major trendline connecting the prior highs. It will be very interesting to see what price does over the next few days.
What Does These Converging Trendlines Mean?: Think of a trendline like a wall... Depending on how "strong" the trendline is, this wall could be made from wood all the way through to vibranium straight from Captain Americas shield! These two trendlines converging would likely resemble a steel wall and would be extremely hard to penetrate. (Although there are no gurantees in trading)
What To Watch For: I will be watching to see if price can both break and confirm above both resistance trendlines. It will take MEGA buying pressure to accomplish this and would likely mean continuation to the upside. If price cannot break and confirm above then we will likely see a large retrace to support.
Thanks everyone and best of luck on your trading journeys!
NVDA - NVIDIA's 3-Drive Pattern target if it plays outThis is the weekly chart of NVDA.
We can clearly see a 3-Drives pattern forming.
If this pattern plays out, the centerline would be my target. Of course, it's still too early to short.
But I’ve got my hunting hat on and I'm watching for signals on the daily chart.
One would be a break of the slanted trendline—but there are a couple of other conditions that need to align as well.
Always ask yourself: What if?
Nvidia at a CrossroadsNvidia at a Crossroads: Unstoppable Growth, Geopolitical Tensions, and Fears of Talent Drain to China
Ion Jauregui – Analyst at ActivTrades
Nvidia’s rise as a central player in the artificial intelligence revolution has not been a solitary journey. The company, now valued at over $4 trillion, has built a complex network of suppliers, strategic clients, and industrial partners that fuel its growth. However, this success has also placed the firm under the scrutiny of U.S. authorities, especially amid growing fears of knowledge transfer to China.
Washington on Alert: National Security Risks?
The U.S. government has begun to closely monitor the hiring of foreign talent in strategic sectors. One of its main concerns is the potential unintentional transfer of advanced military knowledge to China through engineers working at companies like Nvidia. The company’s chips power everything from data centers to autonomous systems, and part of its strength lies in the know-how contributed by its employees—many of whom are of Asian descent—to the development of these key technologies.
Although the company benefits enormously from hiring highly skilled engineers—many of them trained in U.S. universities—there is concern in Capitol Hill and the Pentagon that some of these specialists, directly or indirectly, could end up collaborating with China’s People’s Liberation Army. The U.S. Department of Commerce and the Pentagon have increased scrutiny of technical staff with links to China, particularly after identifying several cases of dual-nationality engineers involved in sensitive projects. According to intelligence sources cited by outlets such as Bloomberg and The Washington Post, internal investigations have been launched to review hiring policies at key semiconductor companies. There is concern that without stricter measures, U.S. technological know-how—especially related to dual-use civilian-military GPUs—could leak and accelerate the development of Chinese military capabilities, including AI for warfare.
The Ecosystem Powering Nvidia
Nvidia does not manufacture its own chips: it relies primarily on Taiwan Semiconductor Manufacturing Company (TSMC), which produces its most advanced units—such as the H100 and the new B200 Blackwell chips—using 3 and 4 nanometer processes. Pressure from the U.S. government to relocate production led TSMC to build a factory in Arizona as a geostrategic response to ensure supply on American soil.
Additionally, companies like SK Hynix, Micron, Wistron, and Flex form a key supply chain, providing everything from HBM memory to full system assembly. In parallel, Nvidia has accelerated development of the HBM4 chip amid growing competition from new players such as AMD and AI divisions of Chinese firms.
An AI-Powered Empire: Voracious Clients and Strategic Alliances
Meanwhile, Nvidia’s rise has been meteoric. From a napkin sketch in 1993 to a market cap surpassing $4 trillion, the company has gone from revolutionizing video games to becoming the heart of artificial intelligence. The key lies in its GPUs (such as the H100 and the new B200), which power language models like ChatGPT and Llama-4.
Its supplier network includes TSMC, SK Hynix, Micron, and Wistron, while on the demand side, Microsoft, Meta, Amazon, Alphabet, and Super Micro are among the giants boosting its revenue. In fact, Microsoft alone accounts for nearly 19% of Nvidia’s revenue. Microsoft leads with over $29 billion invested, while Meta allocates more than 9% of Nvidia’s total revenue to training its Llama-4 model. Even Amazon, which develops its own Trainium and Graviton chips, continues to purchase Nvidia GPUs due to high customer demand for cutting-edge products.
Now, all hopes are pinned on the new generation of Blackwell chips. The B200 promises performance up to 30 times higher than the H100 in generative AI tasks, positioning it as the new industry standard. But as the market matures, competition, regulation, and geopolitical risks are all intensifying.
Technical Analysis of Nvidia (NVDA)
Nvidia (NVDA) shares closed yesterday at $164.07, slightly below its all-time high of $167.89. On the daily chart, we observe a consolidation movement after hitting a new record high on Friday. The price remains within an upward channel that began in January 2024.
Key Support: $141.75 (above the 50-session moving average), a level defended by buyers during recent pullbacks.
Immediate Resistance: $167.89 (all-time high). A breakout with volume could open the door to $180 as the next psychological target.
Technical Indicators:
The daily RSI stands at 72.95%, reflecting strong overbought conditions and suggesting continued buying interest.
The moving averages remain in a wide bullish crossover, with no clear sign of directional reversal.
The volume point of control (POC) sits at $118, at the lower end of the consolidation zone.
The MACD continues in a bullish crossover pattern, although it’s starting to show a loss of momentum. This could signal that the price push is weakening, indicating a bearish divergence between price and volume.
The technical outlook remains bullish, but a short-term pause or sideways movement is not out of the question—especially if regulatory pressure or the next quarterly results fail to meet high market expectations. The key level to watch is around $141 as the structural support to maintain the uptrend.
The Future? A Mix of Innovation and Oversight
Nvidia embodies the spirit of Silicon Valley, but its privileged position also makes it a central piece on the global geopolitical chessboard. While its technology drives scientific, medical, and consumer advancements, its ties to Asia and openness to foreign talent will continue to spark friction with Washington.
The big question is whether it can continue to lead the AI race without destabilizing the delicate balance between national security and technological innovation. Time—and the regulators—will tell.
*******************************************************************************************
The information provided does not constitute investment research. The material has not been prepared in accordance with the legal requirements designed to promote the independence of investment research and such should be considered a marketing communication.
All information has been prepared by ActivTrades ("AT"). The information does not contain a record of AT's prices, or an offer of or solicitation for a transaction in any financial instrument. No representation or warranty is given as to the accuracy or completeness of this information.
Any material provided does not have regard to the specific investment objective and financial situation of any person who may receive it. Past performance and forecasting are not a synonym of a reliable indicator of future performance. AT provides an execution-only service. Consequently, any person acting on the information provided does so at their own risk. Political risk is unpredictable. Central bank actions can vary. Platform tools do not guarantee success.
NVDA📊 NVIDIA (NVDA) – Daily Chart Technical Analysis
Entry Point:
A long position is considered at $158, assuming the price holds above $157.78.
Resistance & Target:
The first target is set at $163, which is a clear resistance zone on the chart based on historical price reactions.
If momentum continues beyond that, higher targets could be considered in future analysis.
Stop Loss:
A tight stop-loss is placed just below key support at $157 to manage risk.
🔄 Weekly Bearish Scenario:
If the price closes below $157, this invalidates the bullish setup:
The first downside target would be $146, which is a previously established support zone.
A further drop could extend toward $115, especially if broader market weakness or sector rotation occurs.
📌 Key Technical Zones:
Support Zones: $157.78, $157.00 (critical for bullish continuation)
Resistance Zones: $158.12, $163.18
Multiple historical rejections and price consolidations are noted near these zones, highlighting their significance.
Summary:
As long as NVDA remains above $157.78, the outlook remains bullish targeting $163. However, a confirmed breakdown below $157 could shift the sentiment sharply bearish, targeting $146 and possibly $115.
