I'm Long $PEP - new trade, Watch,imitate and make moneyI'm Long on PEP - new trade, Watch,imitate and make money
direction on the chart.
Take a look at my past trades in my signature.
PEP trade ideas

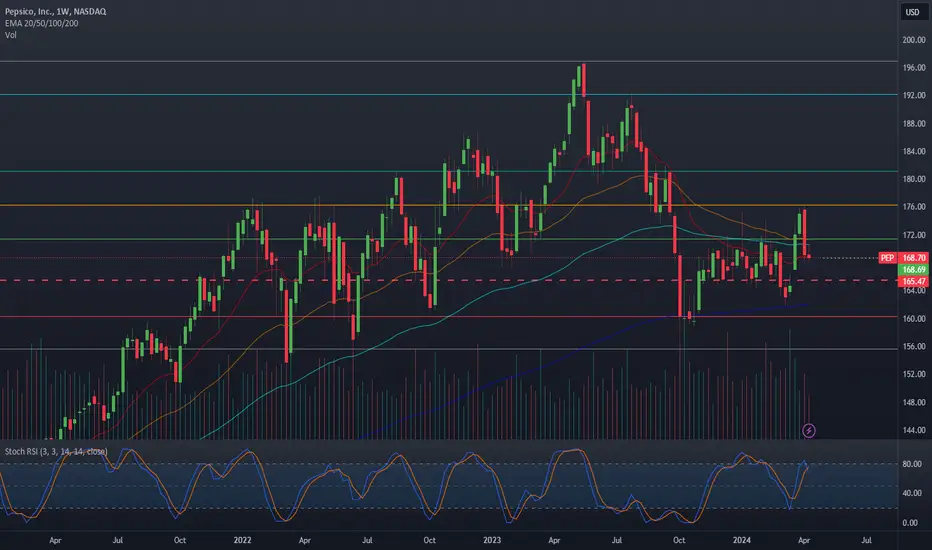
PEP breakout expected , US Stock167.50 above trendline breakout
169 above horizontal resistance breakout possible
172/174/177/180 expected to test

PEP is BullishPrice has given a good breakout after bullish RSI divergence appeared on daily time frame, previous lower high is broken successfully and if the same momentum continues, we can expect a bullish rally from here. Targets are mentioned on the chart.

PepsiCo _ Next Target is Triangle Pattern TopPepsiCo is forming a Triangle Pattern. The Next Target is the Top of the Triangle. If it doesn't Breakout above the Triangle Pattern (or) Resistance, the market is Expected to move downward again, anticipating a breakout at the bottom of the triangle. If there is a breakout at the bottom of the triangle, the market Expects a 27% fall. Because PepsiCo has been trading within two parallel lines, or a channel, since 2009. Therefore, if it breakout on the bottom side of the triangle pattern, the market could fall to at least the 0.3 Fibonacci Retracement level. Refer to this below image :
Support me; I want to Help People Make PROFIT all over the "World".

PepsiCo Stock Rebounds from Yearly Low Ahead of Earnings ReportPepsiCo Stock Rebounds from Yearly Low Ahead of Earnings Report
The PepsiCo stock chart indicates:
→ Yesterday, the price dropped below $161, setting a new low for 2024.
→ However, by the end of the trading day, the price rose above $163.3, closing near the day's high.
This bullish intraday behaviour might suggest positive sentiment emerging ahead of today's earnings report.
According to Dow Jones Newswires:
→ PepsiCo's management anticipates organic revenue growth of 4% and an 8% increase in earnings per share in 2024.
→ The consensus among analysts tracked by FactSet is a 3% rise in sales and a 7% increase in earnings.
PepsiCo's stock has fallen by 9% over the past two months. Investors are concerned that demand might suffer due to rising prices from inflation and the growing popularity of weight-loss drugs, which could curb people's cravings for snacks and sugary drinks.
Technical Analysis of the PEP Daily Chart Today Shows:
→ In the long term, the PEP price is in an uptrend (shown in blue).
→ The price decline from the May high (point A) has brought the price to the lower boundary of this channel, suggesting a potential buying opportunity.
→ The RSI indicator at point B (13 June) fell into the oversold zone, and yesterday's price action might be forming a bullish divergence.
Today's earnings report will provide more clarity. If investors see strong sales results, the PEP stock price might receive a bullish boost. In such a case, resistance could be encountered around the $170 level.
According to TipRanks analysts' forecast monitoring, the average target price for PEP stock is $187.40, representing a 14.55% increase from current levels in the next 12 months.
This article represents the opinion of the Companies operating under the FXOpen brand only. It is not to be construed as an offer, solicitation, or recommendation with respect to products and services provided by the Companies operating under the FXOpen brand, nor is it to be considered financial advice.

PepsiCo: Analyst Bullish Despite Slowdown, Sees 17% UpsidePepsiCo, the giant in the beverage and snack food industry, is currently under the spotlight as analysts adjust their price targets ahead of its upcoming quarterly earnings report. Amidst varying evaluations, one Wall Street analyst remains notably optimistic about the stock's future, suggesting a significant upside potential.
Banking on Continued Profitability:
Analyst Bryan Spillane of Bank of America Securities remains bullish on PepsiCo despite lowering his price estimate from $210 to $190 per share. Spillane's objective suggests a potential 17.2% increase over the following 12 months, demonstrating significant confidence in PepsiCo's steady profitability and earnings power.
PepsiCo's Financial Resilience:
Spillane acknowledges some concerns regarding soft demand in the food and beverage sector but believes PepsiCo's current valuation is attractive. The company has a solid track record of profitability, supported by its strategic pricing and product placement. Spillane's confidence is further bolstered by PepsiCo's ability to maintain healthy profit margins despite industry challenges.
PepsiCo's Strengths and Opportunities:
PepsiCo has always been a favorite choice for investors due to its diverse product portfolio and consistent dividend payouts. The company's strong presence in both snacks and beverages ensures a steady revenue stream. Presently, PepsiCo offers a dividend yield of over 3%, making it an appealing option for income-focused investors.
Growth Amidst a Slowdown:
Even with recent concerns about a slowdown, PepsiCo's results remain robust. Despite a modest 2.3% sales increase in Q1, this follows years of consistent revenue growth. In 2023, the company's sales increased by 8.7%, with a 10-year CAGR of 3.3%, showcasing PepsiCo's resilience and consistent growth capability.
Pricing Strategies:
PepsiCo's revenue growth has largely been driven by strategic price increases. Despite higher prices potentially affecting volume sales, the company has successfully increased its overall revenue. This approach underscores PepsiCo's strong brand equity and its ability to navigate market dynamics effectively.
Valuation and Dividend Appeal:
Given PepsiCo's current trading price, investors have a valuable opportunity. The price-to-earnings (P/E) ratio of the stock is currently 20.6, which is less than its historical average of 23 to 25. With PepsiCo's astounding record of 52 years of dividend increases, this reduction presents a unique opportunity to purchase shares at a discount in a dependable and rapidly expanding business.
Broader Industry Context:
The non-alcoholic beverage market is evolving, with major brewers like Carlsberg expanding their soft drink portfolios to adapt to changing consumer preferences. Carlsberg's recent acquisition of Britvic, a Pepsi and Lipton distributor, underscores the growing importance of the non-alcoholic segment. This trend reflects a broader industry shift towards diversification and catering to health-conscious consumers.
Strategic Implications:
PepsiCo is well-positioned for future growth thanks to its sustained emphasis on both its core products and smart acquisitions. The company remains an appealing option for investors seeking steady returns due to its robust dividend policy and ability to balance price hikes with volume sales.
Conclusion:
PepsiCo remains a strong contender in the beverage and snack food market, with analysts like Bryan Spillane projecting significant upside potential. Despite a recent slowdown in growth, the company’s strategic pricing, consistent profitability, and attractive valuation present a solid investment opportunity. As PepsiCo prepares to release its second-quarter earnings, investors should closely monitor its performance and consider the long-term benefits of holding PEP stock in their portfolios.

$PEP head and shoulderspossible bearish head and shoulders on the all time chart for pepsi NASDAQ:PEP

Three Bullish Signals for PepsiCoThree Bullish Signals for PepsiCo
1) Earning report on 11th July
2) Support by 200days Weekly MA
3) Immediate support level $160

PEP Long 08/05/2024Asset and Time frame - PEP, Weekly
Entry Price - 178.12
Exit(Stop Loss) -172.91
Exit(Take Profit) - 196.86
On the daily chart, the price has started breaking the 10-day swing high with a restest, but the main timeframe here is weekly, on the weekly chart, the price broke the 100SMA & the swing high after making an indecision candle and seems to start going north, the price also retraced back from the -61.8 level seem to start a reversal back then but there wasn't any good conviction, the market is a bit bearish imo atm, so lower risk of 0.75% instead of the usual 1%
Calibration - about 40% success rate, missing a candle pattern unfortunately at the break


PEP Bullish NotesThe past couple of weeks PEP has been trading inside a symmetrical triangle which within appears to has formed an ascending triangle. Breakout from both happened arround may 6 with above average volume and now price could potentially reach 196 up to 206 price target.
There is a golden cross nearly done in Weekly and the price has recently bounced from EMA 200 that's been the main suppor of the upward trendline since 2010.
Looks like a healthy upward move.
Target 196-206
Stop 175 NASDAQ:PEP

The Stock Price of Pepsico Is Retracting from Its Yearly HighThe Stock Price of Pepsico (PEP) Is Retracting from Its Yearly High
On April 23, the quarterly report of PepsiCo's performance for the first quarter was published, which was awaited anxiously.
The issue stemmed from the fact that in December 2023, the U.S. Food and Drug Administration (FDA) announced the recall of over 40 Quaker Oats products – a company owned by PepsiCo – due to potential salmonella contamination. This led to a 22% decline in sales volume of Quaker Food products in the first quarter.
However, the report exceeded expectations:
→ Earnings per share: Actual = $1.16, Expected = $1.518;
→ Gross revenue: Actual = $18.25 billion, Expected = $18.08 billion.
By April 25, the stock price of PepsiCo (PEP) reached its yearly high, surpassing the $180 mark.
Then, this week, specifically May 13, the stock price of PepsiCo (PEP) hit a new yearly high, exceeding $181.
Technical analysis of the PEP stock chart shows that:
→ The price is moving within a long-term ascending channel (shown in blue);
→ Starting from March, the price is forming a short-term, steeper ascending channel (shown in green).
Thus, the price of PEP stock has risen by approximately 10% since the beginning of March. This may motivate shareholders to take profits. By the way, according to SEC Form 4 information, David Flavell, Vice President, General Counsel, and Secretary of PepsiCo, sold over 6,000 shares on May 10.
Therefore, it is plausible to assume that the PEP stock market is in a vulnerable position for a retracement, considering that resistance to further price growth in the short term could be:
→ The psychological level at $180;
→ The median line of the blue channel.
If a correction scenario unfolds, a decline to the lower boundary of the green channel cannot be ruled out.
According to TipRanks, analysts' average forecasted price for PEP stock is $190 within 12 months.
This article represents the opinion of the Companies operating under the FXOpen brand only. It is not to be construed as an offer, solicitation, or recommendation with respect to products and services provided by the Companies operating under the FXOpen brand, nor is it to be considered financial advice.

PEP PepsiCo Options Ahead of EarningsIf you haven`t bought the dip on PEP:
Then analyzing the options chain and the chart patterns of PEP PepsiCo prior to the earnings report this week,
I would consider purchasing the 175usd strike price Calls with
an expiration date of 2024-6-21,
for a premium of approximately $4.70.
If these options prove to be profitable prior to the earnings release, I would sell at least half of them.

The Most successful trades are the ones that follow your planTrading is simple but it is not easy
If It was easy everyone will be making money, it is simple in the sense that a set trading plan once followed can yield positive probability results.
I will teach you my most successful trading method. I have been using this method for years & it is no secret, this trading technique is used by many traders, the more traders who use this technique the more of a true self fulfilling it becomes.
Use three charts, a Long-term Chart, a Current term chart and a smaller term Chart.
Identify the long-term trend on the long-term chart. if the trend is up. use the Current-term chart to identify a correction into a qualified DZ. use the small-term chart to time your entry, time your stop loss and time your profit targets.
This is the theory of a successful trading strategy. for the practice check out my other trades.
In this long trade on PEP Pepsi, the long-term (M) is an uptrend. the price corrects into a DZ, that also happens to be the Higher Low of the (M) uptrend. the Long trade was initiated & two profit targets were reached when the price held steady proofing a price correction & not a trend reversal.

PEP bullish englufingPEP had a strong bullish engulfing candle today after a small selloff on positive earnings. I did enter the position with some cash on my last charge post for PEP. Fundamentally I think 192-200$ over the next year sounds reasonable. This is not going to produce astronomical gains, but reasonable and safer gains as we approach recession territory. I believe the government will do anything they can to make the stock market look good during elections.

Has broken out⤴️Charts are looking bullish 🐂
Prices heading upwards to next fib resistance level🎯
We have mapped out where we expect prices to move🧭

PepsiCo Beats Q1 Revenue ForecastsPepsiCo ( NASDAQ:PEP ), a multinational food, snack, and beverage corporation headquartered in Purchase, New York, exceeded revenue expectations in the first quarter of the year, driven by strong international demand for its snacks and beverages.
During the January-April period, the company reported a 2% increase in revenue to $18.3 billion, surpassing Wall Street's $18 billion forecast as per the analysts polled by FactSet.
Frito-Lay's revenue rose by 2% in North America, while Pepsi beverage sales increased by 1%. However, sales were impacted by the recall of Quaker Oats cereal, bars, and snacks early in the quarter due to potential salmonella contamination, which caused Quaker Foods sales to plummet by 24% during the quarter.
Despite fewer products on grocery shelves in some countries, PepsiCo ( NASDAQ:PEP ) experienced 11% sales growth in Asia Pacific and 10% sales growth in Europe. Carrefour, one of Europe's largest supermarket chains, withdrew PepsiCo products from its shelves in France, Belgium, Spain, and Italy in January due to unacceptable price hikes, but the two companies resolved their pricing dispute, and Carrefour resumed restocking PepsiCo products in early April.
To tackle rising ingredient costs, PepsiCo ( NASDAQ:PEP ) has relied heavily on price increases over the last two years. The fourth quarter of 2023 marked the company's eighth consecutive quarter of double-digit percentage price hikes. However, these increases moderated in the first quarter, with PepsiCo reporting a 5% global net pricing increase and a 2% decline in volumes. The company attributed some of the volume decline to a strategic move to shrink package sizes to meet consumer demand for convenience and portion control.
Despite all that In premarket trading on Tuesday, PepsiCo's ( NASDAQ:PEP ) shares remained unchanged.
PepsiCo's ( NASDAQ:PEP ) net earnings increased by 5.6% to $2 billion in the first quarter. Excluding special items, the company earned $1.61 per share, beating Wall Street's forecast of $1.52.
PepsiCo ( NASDAQ:PEP ) stock closed at 68.58 Relative Strength Index (RSI) Monday's trading session above its respective Moving Averages (MA's)

PEP new addition to long-term portfolioToday I finally added PEP to my long-term portfolio. This is a value play for me and I plan on parking a large amount of cash here over-time. I expect this to heavily out-perform money market this year. My plan is to sell this a year plus out to capture the value discount we see here. I am a very heavy buyer if we dip to 165$ here.
-I like to have defensive value stocks as a large portion of this portfolio because I exposed to tremendous risk and volatility with my larger altcoin bag
-This is my general barbell strategy, super high risk alts > profit take into money market/value stocks/ and quality long holds like HMDPF
PEP potential buy setupReasons for bullish bias:
- Price gave range breakout
Here are the recommended trading levels:
Entry Level(CMP): 174.16
Stop Loss Level: 161.62
Take Profit Level 1: 186.7
Take Profit Level 2: Open

Pepsico Investment OpportunityPepsico reached a Monthly demand zone before reacting.
1) Weekly big liquidity was taken (dotted line)
2) Price Reacted and took again a liquidty in daily timeframe before braking the structure and become bullish
I'm expecting the price now to continue to be bullish and reaching new highs.
Downside risk 8%
Upside gain 25-35%

PEPSICO - Low Risk High Reward - BullishNASDAQ:PEP
-Has been on a bull run since 1981
-Every while does a 10-20% correction,
(and up to a 40% correction in case of a major economic crisis)
-Always goes back up to a new all-time-high...always
-Is now done about 20% from all-time-high
-Prices now are the same as it was in Nov 2021
-The last time it did such a correction was in 2020
I would say it is a no-brainer for those who are looking for low-risk trades, I would go in with no stop loss even since it will find its way back up.
*Not Financial Advice*

PEP (PEPSI) Is ready to RISEThere is a bullish candle and the RSI has risen sharply forming a breakaway gap and the stock is ready to rise higher on increased momentum

Diagonals in ElliottwaveSome old and new rules when it comes to diagonals.
Further notice can be added that diagonals actionary waves can be composed either by zig zags or impulses
so Waves
1/3/5 can be Impulse
or
1/3/5 zig zags
We cant have hybrids where we mix zig zags and impulses.
Actionary waves in ending diagonals can only be formed by zig zags and never Impulses.
Every reactionary wave (or corrective wave) in a diagonal must be a zig zag (or a zig zag family, meaning double or tripple sharp zig zag)
