PLTR Trade Update – July 11, 2025📅
PLTR held the breakout like a champ. ✅ After a clean move through the triangle resistance yesterday, today’s price action continues to build strength above $142.50.
🔼 Bulls are in control, riding the momentum with higher lows and tight consolidation near breakout levels.
🎯 Targets remain firm at
100 ARS
423.22 B ARS
2.62 T ARS
About Palantir Technologies Inc.
Sector
Industry
CEO
Alexander Caedmon Karp
Website
Headquarters
Denver
Founded
2003
ISIN
AR0132889822
FIGI
BBG01M5Z8WY1
Palantir Technologies, Inc. engages in the business of building and deploying software platforms that serve as the central operating systems for its customers. It operates through the Commercial and Government segments. The Commercial segment focuses on customers working in non-government industries. The Government segment is involved in providing services to customers that are the United States government and non-United States government agencies. The company was founded by Alexander Ceadmon Karp, Peter Andreas Thiel, Stephen Cohen, Joseph Lonsdale, and Nathan Dale Gettings in 2003 and is headquartered in Denver, CO.
Related stocks

Earnings HFT gapsThe gaps that form during earnings season on or the next day after the CEO reports the revenues and income for that past quarter are always HFT driven. The concern over the past 2 previous quarters was the fact that the High Frequency Trading Firms were incorporating Artificial Intelligence into the

PLTR DUMP INCOMINGdump it dump it dump it.
huge resistance off yearly level. gap on daily chart. Untested levels acting as a magnet lower. Dump it.

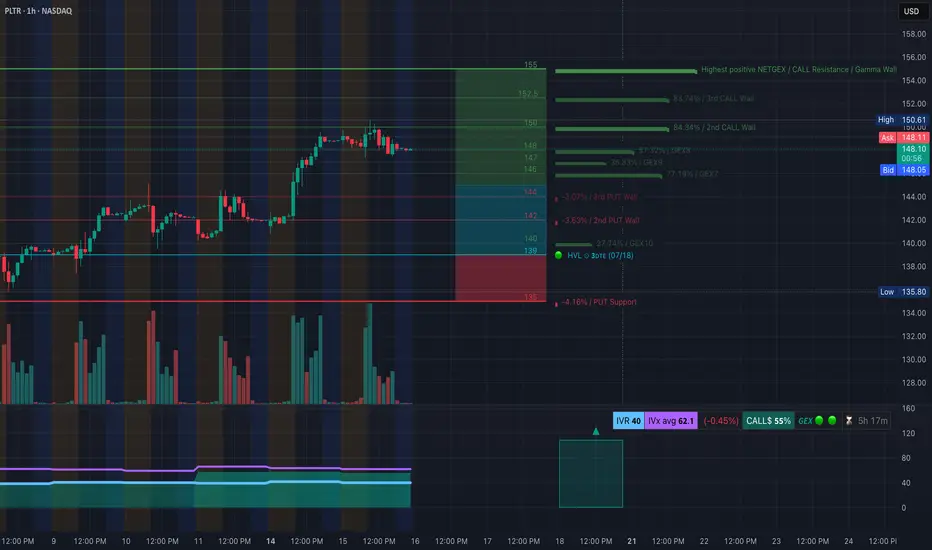
PLTR Poised for Gamma Squeeze? Here's the Key Setup-July 10📈 GEX Options Sentiment & Trade Strategy
Palantir (PLTR) is pressing into a high-compression zone on the Gamma Exposure (GEX) chart, where multiple call walls cluster between 143 → 146, with the strongest net positive GEX wall at 146, acting as the gamma squeeze ceiling. The 3rd call wall sits at ~1

PLTR Approaching Key Gamma Resistance–Will 140 Break or Reject?🔍 Options Sentiment (GEX Analysis):
PLTR is pushing into a high gamma zone with notable resistance from options positioning:
* Call Walls are stacked at 140, 142, and 145, with the 145 line aligning with a GEX10 and 2nd Call Wall (86.54%). This suggests significant overhead resistance and a possible

PLTR: Sell ideaSell idea on PLTR as you can see on the chart if and only if we have the breakout with force
the Belkhayate Iceberg, the vwap and the support line by the sellers.

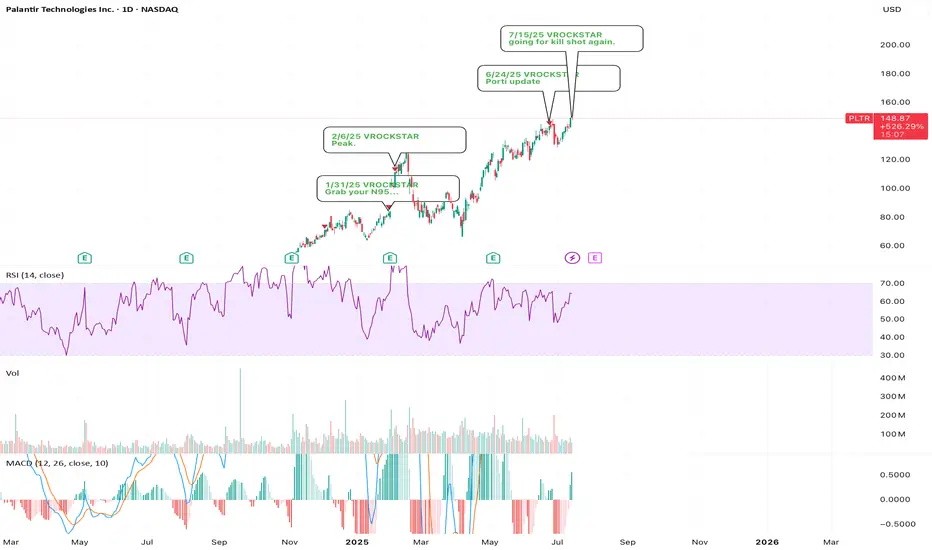
7/15/25 - $pltr - going for kill shot again.7/15/25 :: VROCKSTAR :: NASDAQ:PLTR
going for kill shot again.
- using the 2x levered meme etf PTIR to buy P's
- there are no logical explanations anymore for me to justify valuation "yeah V valuation doesn't matter"... you'll see what i mean, kid
- even 2x'ing FCF over the next 2 yrs and this th
PLTR Sitting on the Edge! Will $147 Hold or Break? July 16Technical Overview:
PLTR is showing signs of a distribution top after a strong rally. The most recent 1H structure shows a Change of Character (CHoCH) just under $149 with lower highs forming and weak bullish reaction.
* CHoCH confirmed under $148.50
* Price struggling inside supply zone: $148.50–$1
Trade Reflection – PLTR Long Setup🧠
Lately, I’ve been focusing on breakouts from key resistance levels supported by ascending trendlines. Today’s trade on NASDAQ:PLTR was a textbook example.
📈 Ticker: PLTR
🔁 Trade Type: Long
🕒 Timeframe: 30-min
📍 Entry Zone: $139.24 (Pre-market breakout)
🎯 Target: $146.66
🛑 Stop Loss: Below $137.

PLTR - Palantir Technologies: Why PLTR is the Perfect PlayExceptional Performance Leadership
Palantir Technologies has established itself as the undisputed champion of the U.S. stock market in 2025. The stock has delivered extraordinary returns of 402.92% over the past 12 months and 87.89% year-to-date, making it the best-performing stock in both the S&P

See all ideas
Summarizing what the indicators are suggesting.
Oscillators
Neutral
SellBuy
Strong sellStrong buy
Strong sellSellNeutralBuyStrong buy
Oscillators
Neutral
SellBuy
Strong sellStrong buy
Strong sellSellNeutralBuyStrong buy
Summary
Neutral
SellBuy
Strong sellStrong buy
Strong sellSellNeutralBuyStrong buy
Summary
Neutral
SellBuy
Strong sellStrong buy
Strong sellSellNeutralBuyStrong buy
Summary
Neutral
SellBuy
Strong sellStrong buy
Strong sellSellNeutralBuyStrong buy
Moving Averages
Neutral
SellBuy
Strong sellStrong buy
Strong sellSellNeutralBuyStrong buy
Moving Averages
Neutral
SellBuy
Strong sellStrong buy
Strong sellSellNeutralBuyStrong buy
Displays a symbol's price movements over previous years to identify recurring trends.