Guys take profit for PLN. A big correction coming soon.Guys take profit for PLN. A big correction coming soon. Based on technical, all the stock market over bull and a big correction coming with in a month. Pls be careful.
PLTR trade ideas
Palantir Technologies: Long Opportunity Amid AI MomentumCurrent Price: $153.52
Direction: LONG
Targets:
- T1 = $159.20
- T2 = $165.80
Stop Levels:
- S1 = $150.70
- S2 = $147.30
**Wisdom of Professional Traders:**
This analysis synthesizes insights from thousands of professional traders and market experts, leveraging collective intelligence to identify high-probability trade setups. The wisdom of crowds principle suggests that aggregated market perspectives from experienced professionals often outperform individual forecasts, reducing cognitive biases and highlighting consensus opportunities in Palantir Technologies.
**Key Insights:**
Palantir Technologies is positioned as a leading player in the AI and defense sector. Its profitability, expanding government contracts, and commercial growth provide solid fundamentals for long-term value. Institutional interest in Palantir has surged, with strong demand for its distinctive AI-driven analytics and software platforms. The upcoming earnings report on November 4, 2025, offers a potential catalytic event likely to further attract institutional buyers. Traders are exploiting the rising demand for AI-driven solutions, making near-term resistance and support levels critical for short-term opportunities.
The company’s leadership in data analytics and AI integration has positioned it as a pivotal contributor in both government and enterprise applications. Its ongoing investments in research, product offerings, and customer partnerships add to the bullish narrative, with many analysts suggesting transformational upside potential in the medium to long-term.
**Recent Performance:**
Palantir Technologies has seen a steady upward momentum in recent weeks. In response to market pullbacks earlier this year, the stock demonstrated resilience, largely driven by a combination of strong fundamentals and enthusiastic sentiment surrounding AI markets. The stock recently edged closer to its 52-week high, reflecting growing levels of institutional accumulation and alignment with Palantir's ambitious growth projections.
**Expert Analysis:**
Professional analysts remain overwhelmingly bullish on Palantir's stock, citing strong growth prospects in AI integration, robust government contract pipelines, and its near-indispensable role in defense applications. Institutional investors highlight the company’s ability to convert monetary investments into consistent performance, arguing its AI-driven platform raises barriers against potential competitors. Analysts observe a convincing technical setup, indicating sufficient momentum to breach resistance and establish new highs over the next quarter. Palantir’s strong customer relationships in government markets remain a testament to its credibility and expertise.
**News Impact:**
Palantir has benefitted from positive headlines, especially its increasing involvement with government defense initiatives and autonomous systems technologies. The company’s highly anticipated earnings announcement will likely shape the next major price move, with investor sentiment strongly skewed toward upside surprises. Additionally, market participants are closely watching Palantir's ability to secure long-term contracts, which have driven further confidence in its growth trajectory.
**Trading Recommendation:**
In light of Palantir’s current price action, institutional interest, and AI momentum, a long position is recommended. With clear price targets of $159.20 (T1) and $165.80 (T2), and risk managed via stop losses at $150.70 (S1) and $147.30 (S2), this trade setup aligns with both technical and fundamental insights. As the AI sector continues to expand and Palantir strengthens its dominance in government and commercial markets, the stock presents a tactical opportunity for traders seeking high-potential rewards.

PLTR moving higherPLTR expected to move higher.
The price is bouncing off the 20MA and respecting it.
Making new higher/highs and higher lows.
Earnings is due shortly, which could have a negative impact to the price.
However, the long term outlook for the company is still strong.
Anyone else have thoughts on this stock?

Jade Lizard on PLTR - My 53DTE Summer Theta PlayMany of you — and yes, I see you in my DMs 😄 — are trading PLTR, whether using LEAPS, wheeling, or covered calls.
I took a closer look. And guess what?
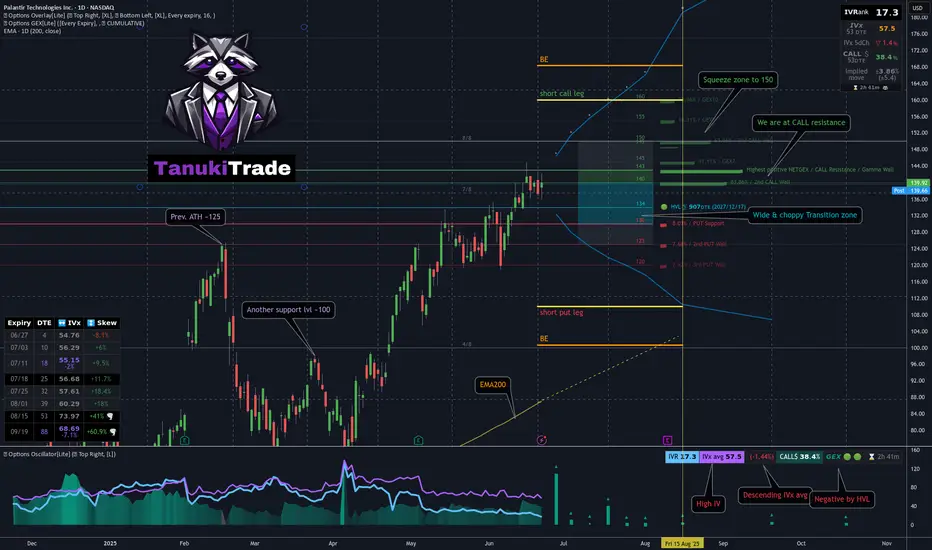
📈 After a strong move higher, PLTR was rejected right at the $143 call wall — pretty much all cumulative expiries cluster resistance there
Using the GEX Profile indicator, scanning all expirations:
After a brief dip, the market is repositioning bullish
Squeeze zone extends up to 150
The most distant GEX level is sitting at 160
On the downside, 130 is firm support, with some presence even at 120 — the market isn’t pricing in much risk below that
📉 From a technical standpoint:
We’re near all-time highs
125 (previous ATH) and 100 are key support levels
The OTM delta curve through August is wide, and the call side is paying well — with a current call pricing skew
🔬 IVx is at 57, trending lower + call pricing skew📉 IV Rank isn't particularly high, but the directional IVx matters more here
💡 Summer Theta Play: Jade Lizard on PLTR
Since I’ll be traveling this summer and don’t want to micromanage trades, I looked for something low-touch and high-confidence — and revisited an old favorite: the Jade Lizard.
If you're not familiar with the strategy, I recommend checking out Tastytrade's links and videos on Jade Lizards.
🔹 Why this setup?
Breakeven sits near $100, even with no management
On TastyTrade margin:~$1800 initial margin ~$830 max profit
53 DTE — plenty of time for theta to work
Earnings hit in August — I plan to close before then
Covers all bullish GEX resistance zones
Quickly turns profitable if IV doesn’t spike
Highly adjustable if needed
My conclusion: this strategy covers a much broader range than what the current GEX Profile shows across all expirations — so by my standards, I consider this to be a relatively lower-risk setup compared to most other symbols right now with similar theta strategies.
🔧 How would I adjust if needed?
If price moves up:
I’d roll the short put up to collect additional credit
Hold the call vertical as long as the curve supports it
If price drops:
Transition into a put ratio spread
Either extend or remove the call vertical depending on conditions
🛑 What’s the cut loss plan?
I have about 20% wiggle room on the upside, so I’m not too worried — but if price rips through 160 quickly, I’ll have to consider early closure.
If that happens, the decision depends on time:
If late in the cycle with low DTE:→ Take a small loss & roll out to next month for credit
If early with lots of DTE remaining:→ Consider converting to a butterfly, pushing out the call vertical for a small debit→ Offset this with credit from rolling the put upward
As always — stay sharp, manage your risk, and may the profit be with you.
See you next week!– Greg @ TanukiTrade
PLTR TRADE SIGNAL (07/24)
🚨 PLTR TRADE SIGNAL (07/24) 🚨
💥 Expiry in 1 day = HIGH GAMMA risk = BIG MOVES coming
🧠 Key Highlights:
• Call/Put Ratio: 1.40 → bullish options flow
• Strong institutional positioning 📈
• RSI cooling off = ⚠️ watch momentum
• Volume concerns → cautiously bullish
💥 TRADE SETUP
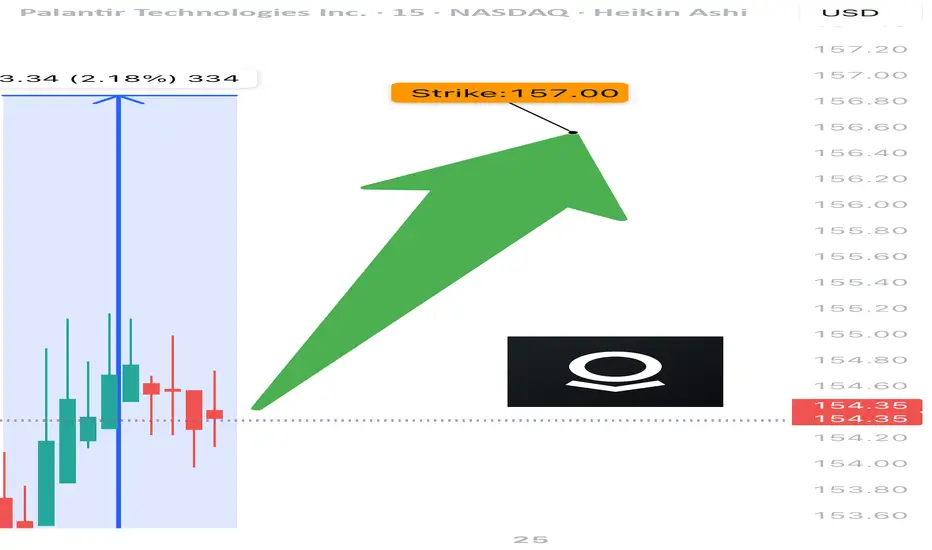
🟢 Buy PLTR $157.50 Call exp 7/25
💰 Entry: $0.59
🎯 Target: $0.89 (50%+)
🛑 Stop: $0.24
📈 Confidence: 65%
⚠️ Gamma + Time Decay = explosive but risky. Tight execution needed.
#PLTR #OptionsAlert #OptionsFlow #UnusualOptionsActivity #TechStocks #DayTrading #GammaSqueeze #TradingView #BullishSetup #CallOption
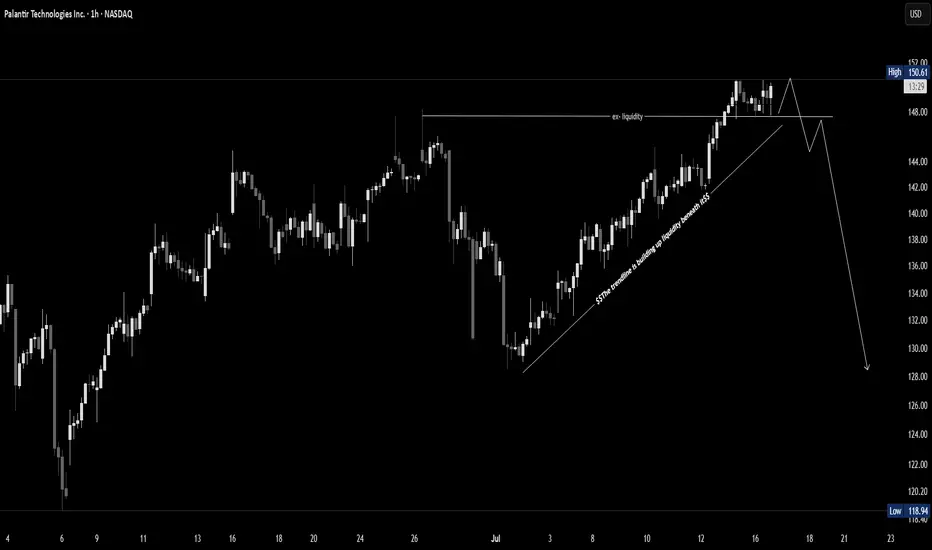
PLTR Sitting on the Edge! Will $147 Hold or Break? July 16Technical Overview:
PLTR is showing signs of a distribution top after a strong rally. The most recent 1H structure shows a Change of Character (CHoCH) just under $149 with lower highs forming and weak bullish reaction.
* CHoCH confirmed under $148.50
* Price struggling inside supply zone: $148.50–$150
* Ascending trendline now broken — possible bearish drift starting
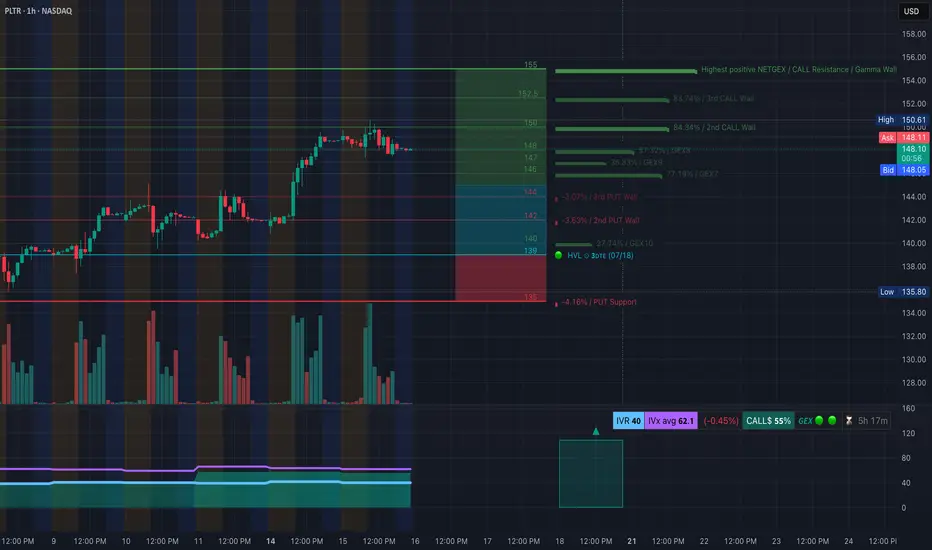
GEX + Options Flow Analysis:
* GEX Resistance Zones:
* $150.00 (83.74% / 3rd Call Wall)
* $152.5 and $155 stacked with heavy GEX Call Resistance
* PUT Walls:
* $144 (3.07%)
* $142 (3.63%)
* Gamma Pivot: $139 = HVL + GEX10 zone
* IVR at 40, with IVx Avg 62.1 → Options relatively quiet, but favoring downside protection
* Call Bias = 55%, but weak
SMC + Price Action:
* BOS followed by CHoCH just beneath $149.15
* Price rejecting inside the OB zone from $148.50–$149.50
* Break of bullish trendline confirms bearish momentum shift
* Downward channel forming under the broken trendline
Trade Scenarios:
📉 Bearish Setup (Favored):
* Entry: $148.20–$148.50 (into supply zone)
* Target 1: $144.50
* Target 2: $139 (HVL + GEX10 support)
* Stop: $150.20
📈 Bullish Breakout (Needs Strength):
* Must break and close above $150
* Entry: Break and retest of $150.50
* Target: $152.5 → $155
* Stop: $148.20
Final Thoughts:
PLTR looks tired near the top of its rally. With GEX resistance above and CHoCH confirmed, the odds favor a pullback unless bulls can reclaim $150 with strength. Watch $147–$144 for possible bounce or breakdown.
This is not financial advice. Please trade based on your own plan and always use proper risk management.
PLTR: (154.63)The idea that I am going to present below is based on technical and institutional entries. PLTR: Bullish Entry (156.00 / 158.00) Bullish Stop (154.00) Bullish Target 160.00 / 162.00 (Bearish Entry 152.00/148.00) Bearish Stop 154.00 (Bearish Target 146.00 / 144.00)
PLTR is doing it... pullback honeyThis video has my thoughts about PLTR and a trading view tip... the data window!!! Who knew?
Hope the talk inspires you as you decide on future investments; especially when it's stalling or pulling back.
My short term bias is bearish for a pullback on PLTR. Not sure when it will happen, but <155 is my trigger to see what I see.
What do you see?
**>162... slow your roll to see if 160 holds.

Palantir Is Up 600%+ Since August. What Do Its Charts Say?National-security software firm Palantir Technologies NASDAQ:PLTR hit a new all-time high this week and has gained more than 600% since hitting a 52-week low last August. What does technical and fundamental analysis say could happen next?
Let's look:
Palantir's Fundamental Analysis
PLTR has been on a tear of late, hitting a $153.91 intraday record high on Thursday. (Full disclosure: I own the stock.)
Shares have been rising in part because NATO member nations recently agreed to increase defense and defense-related infrastructure spending to 5% of each country's gross domestic product -- news that could play right into the company's hands.
Only Spain opted out from among the 32 Western nations that belong to the military alliance, although Canada went along only somewhat reluctantly.
The move surprised many NATO observers. Just some eight years ago, President Trump couldn't get a majority of these nations during his first term to pay what he called their "fair share" -- which was then mandated at only 2% of GDP.
But having a hostile Russian Army in Ukraine knocking at NATO's front door has changed global perceptions of what's fiscally necessary and what's not. Spain and Canada are far away from the Russia-Ukraine war, but some NATO members physically closer to the fighting have far more enthusiastically embraced the new 5% spending target.
What becomes of these promises to boost military spending?
There will, no doubt, still be costly purchases of expensive military hardware like tanks, artillery, aircraft and naval vessels. But intelligence provided by the kind of data-based, AI-assisted analysis that Palantir sells seems likely to only grow in significance.
Purchasing such intelligence (or the high-tech, modern systems to gather it) looks to be far more cost-effective than simply throwing money at things like submarines and fighter aircraft.
That's what nations need these days for national security, as well as what many large businesses need just to compete. All of that sounds like music to Palantir's ears.
The company will report Q2 earnings after the closing bell on Aug. 4, with analysts looking for the firm to post $0.14 in adjusted earnings per share on $939.3 million of revenue.
That would represent a 55.6% increase from the $0.09 in adjusted EPS and 38.5% improvement on the $678.1 million in revenues that PLTR reported for the same period last year.
Of the 19 sell-side analysts I found that cover Palantir, 12 have revised their earnings estimates higher since the current quarter began, while three have lowered their forecasts.
Palantir's Technical Analysis
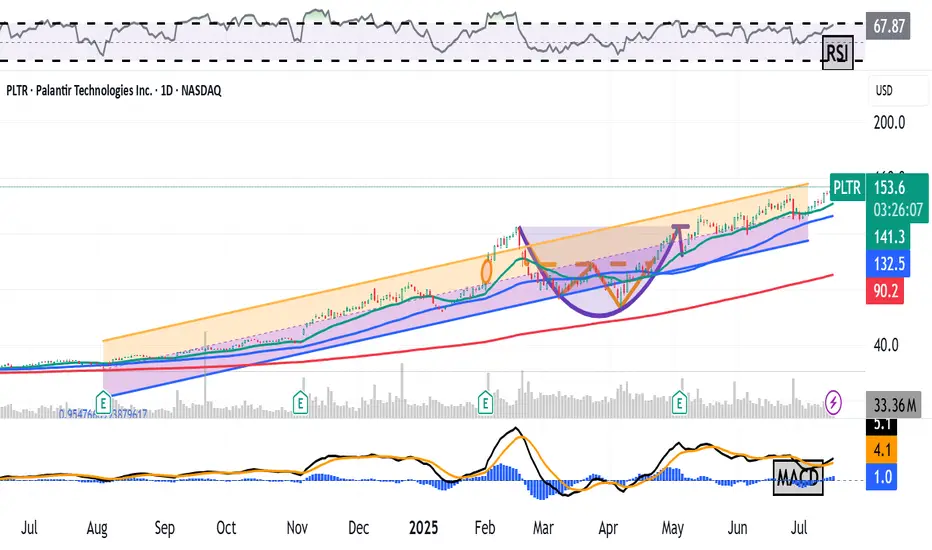
Now let's take a look at PLTR's charts, beginning with this one that runs from January through Tuesday afternoon:
Readers will first note that Palantir continues to break out from the bullish "cup-with-handle" pattern that became visible this spring (shaded purple in the chart above).
The stock's Relative Strength Index (the gray line at the chart's top) also remains quite robust, but is not yet technically overbought.
Similarly, Palantir's daily Moving Average Convergence Divergence indicator (or "MACD," marked with gold and black lines and blue bars at the chart's bottom) is postured bullishly as well.
Within that MACD, the histogram of the stock's 9-day Exponential Moving Average (or "EMA," denoted with blue bars) is above zero. That's often seen technically as short-term bullish.
Meanwhile, Palantir's 12-day EMA (the black line) is back above its 26-day EMA (the gold line), with both in positive territory. That's also a historically bullish signal.
Now let's look at PLTR's chart going back 12 months:
Taking a longer look back, we can take a Raff Regression model (the orange and purple field above) and place it over the stock's price action to better illustrate the trend that's in place.
This view shows PLTR riding its 21-day EMA (the green line above) since mid-April.
Palantir's current pivot is the upper trendline of the model -- about $156 in the chart above vs. the $153.43 that PLTR was trading at on Thursday afternoon.
The stock's 50-day SMA (the blue line at $131.40 in the chart above) represents PLTR's downside pivot, with the Raff Regression model's lower trendline not too far below that for potential support.
(Moomoo Technologies Inc. Markets Commentator Stephen “Sarge” Guilfoyle was long PLTR at the time of writing this column.)
This article discusses technical analysis, other approaches, including fundamental analysis, may offer very different views. The examples provided are for illustrative purposes only and are not intended to be reflective of the results you can expect to achieve. Specific security charts used are for illustrative purposes only and are not a recommendation, offer to sell, or a solicitation of an offer to buy any security. Past investment performance does not indicate or guarantee future success. Returns will vary, and all investments carry risks, including loss of principal. This content is also not a research report and is not intended to serve as the basis for any investment decision. The information contained in this article does not purport to be a complete description of the securities, markets, or developments referred to in this material. Moomoo and its affiliates make no representation or warranty as to the article's adequacy, completeness, accuracy or timeliness for any particular purpose of the above content. Furthermore, there is no guarantee that any statements, estimates, price targets, opinions or forecasts provided herein will prove to be correct.
Moomoo is a financial information and trading app offered by Moomoo Technologies Inc. In the U.S., investment products and services on Moomoo are offered by Moomoo Financial Inc., Member FINRA/SIPC.
TradingView is an independent third party not affiliated with Moomoo Financial Inc., Moomoo Technologies Inc., or its affiliates. Moomoo Financial Inc. and its affiliates do not endorse, represent or warrant the completeness and accuracy of the data and information available on the TradingView platform and are not responsible for any services provided by the third-party platform.
PLTR Just Broke the High - But Don't Get Trapped Palantir just broke its recent high, sparking breakout excitement. But this could be a classic liquidity grab — not a genuine breakout. If price fails to hold and shifts structure, a sharp reversal could follow.
🧠 Wait for confirmation — don’t chase green candles.
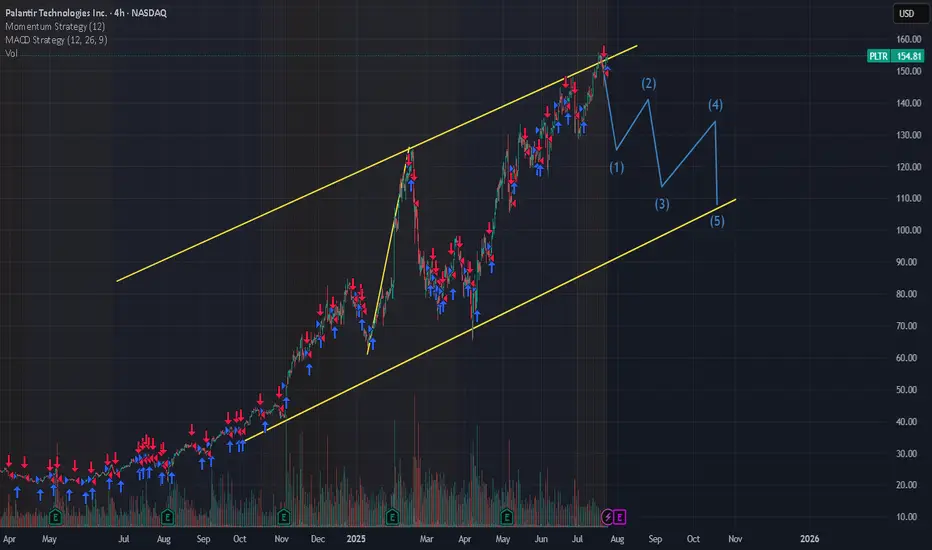
PLTR local top $150Palantir has has a nice run but this could be a local top. Reasons include hitting peak Trendline + hitting 2.618 fib + plus hitting #5 fib time zone. Also BTC appears to hit it's ATH Trendline today as well. So is everything hitting its local top before Trumps Liberation Day II on Aug 1? This week starts off with inflation data tomorrow, VIXEX on Wednesday, Mercury Retrograde starts Thursday, and we have OPEX on Friday. Stay tuned lets see what happens

Earnings HFT gapsThe gaps that form during earnings season on or the next day after the CEO reports the revenues and income for that past quarter are always HFT driven. The concern over the past 2 previous quarters was the fact that the High Frequency Trading Firms were incorporating Artificial Intelligence into their Algos to make automated trading decisions on the millisecond scale. These small lot orders fill the ques milliseconds ahead of the market open in the US and any huge quantity of ORDERS (not lot size) causes the computers of the public exchanges and market to gap up or gap down, often a huge gap.
This can be problematic for those of you who use Pre Earnings Runs to enter a stock in anticipation of a positive to excellent earnings report for this upcoming quarter.
The HFT algos had several major flaws in the programming that did the opposite: The AI triggered sell orders rather than buy order causing the stock price to gap down hugely on good earnings news.
Be mindful that normal gaps due to a corporate event are far more reliable and consistent.
When you trade during earnings season, be aware that there is still added risk of an AI making a mistake and causing the stock to gap and run down on good news.
It is important to calculate the risk factors until it is evident by the end of this earnings season that the errors within the AI programming have been corrected and that the AI will gap appropriately to the actual facts rather than misinterpreted information.

PALANTIR REMAINS YOUR TRADING GOAL, DOUBLING IN PRICE IN 2025In the Faraway Kingdom... In the Thirtieth Realm....
Somewhere in another Galaxy.. in late December, 2024 (yet before The Second Coming of Trump), @TradingView asked at it awesome Giveaway: Happy Holidays & Merry Christmas .
1️⃣ What was your best trade this year?
2️⃣ What is your trading goal for 2025?
Here's what we answered:
1️⃣ What was your best trade this year?
- Surely Palantir NASDAQ:PLTR 💖
I followed Palantir all the year since January, 2024, from $16 per share, watch here .
Current result is 5X, to $80 per share.
Also I added more Palantir after SP500 Index inclusion in September 2024 watch here .
Current result is 2.6X, from $30 to $80 per share.
2️⃣ What is your trading goal for 2025?
- Once again, surely Palantir NASDAQ:PLTR 💖
It's gone 7 months or so... (Wow... 7 months really? 😸😸😸)
Let see what's happened next at the main graph of Palantir stock, to LEARN WHY PALANTIR REMAINS THE TRADING GOAL, DOUBLING IN PRICE IN 2025...
Palantir stock remains an attractive trading goal for several compelling reasons rooted in its strong market performance, innovative technology, and robust growth prospects, particularly in the artificial intelligence (AI) sector.
1. Exceptional Stock Performance and Momentum.
Palantir Technologies has been one of the best-performing stocks in 2025, surging over 80% in the first half of the year alone, vastly outperforming the S&P 500’s modest 5.5% gain. The stock recently hit all-time highs around $149, reflecting a nearly 400% increase year-over-year, underscoring its strong momentum and investor enthusiasm. This surge positions Palantir as a top AI stock to watch, attracting both retail and institutional investors, including conservative entities like the Czech National Bank.
2. Leadership in AI and Data Analytics.
Palantir is not just a data analytics company; it has transformed into a major AI software provider with its Artificial Intelligence Platform (AIP). This platform extends beyond government contracts into commercial sectors such as healthcare, energy, and automotive, fueling significant revenue growth. The company reported a 39% revenue increase to $883.9 million in Q1 2025, driven largely by AI adoption. Its AI platform is gaining traction globally, with many companies rapidly adopting Palantir’s software through short training bootcamps, demonstrating scalable and fast integration.
3. Strong Government and Commercial Contracts.
Palantir’s roots in government intelligence and defense continue to be a significant revenue driver. The U.S. government division alone generated $373 million in Q1 2025, with overall government revenue up 45% year-over-year. Strategic partnerships, such as with Accenture to streamline federal operations and projects like the U.S. Navy’s ‘Warp Speed for Warships,’ highlight Palantir’s expanding footprint in critical government sectors. Simultaneously, the commercial segment is booming, with revenue soaring 71% to $255 million in Q1 and projected to reach $1.178 billion in 2025.
4. Financial Health and Growth Outlook.
Palantir’s financials are strengthening, with no debt and adjusted free cash flow more than doubling to $370.4 million in the recent quarter. Analysts forecast the company’s revenue to exceed $3.5 billion in 2025, up from $2.23 billion the previous year, and project potential revenue of $7 billion by 2028. Operating margins are improving, with a recent quarter reporting a 26% margin, the highest in company history. This solid financial foundation supports further investment in AI innovation and market expansion.
5. Market Position and Competitive Edge.
While Palantir competes with tech giants like Microsoft, Amazon, and Google in the AI and data analytics space, it has carved out a unique niche with its specialized government contracts and AI-driven software solutions. Its ability to integrate complex datasets for real-world operational use distinguishes it from competitors, fostering a loyal investor base and a "cult-like" following among retail investors.
6. High Valuation Reflects Growth Expectations.
Despite a high price-to-earnings ratio (PE around 621), reflecting elevated expectations, many analysts remain optimistic about Palantir’s long-term potential due to its rapid growth and expanding AI capabilities. The company’s market capitalization has soared above $330 billion, surpassing many established corporations, signaling strong market confidence.
7. Palantir stock is a compelling trading goal because it combines robust growth, cutting-edge AI technology, strong government and commercial contracts, and solid financial health.
8. In conclusion, Palantir remarkable stock performance and strategic positioning in the booming AI sector make it a promising investment for traders seeking exposure to transformative technology with significant upside potential.
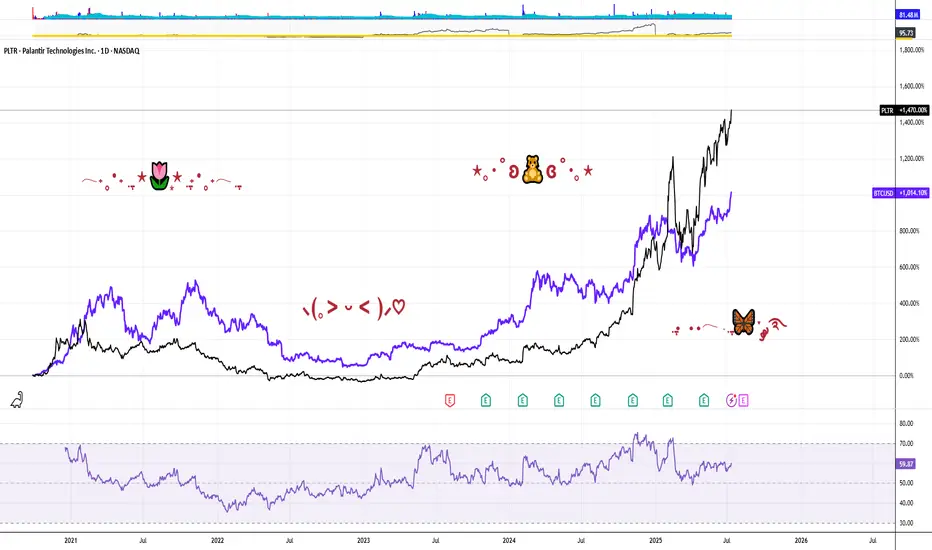
9. ...and yet, Palantir performance since inception (It ultimately went public on the New York Stock Exchange through a direct public offering on September 30, 2020) is better, rather then Bitcoin.
--
Best wishes,
@PandorraResearch Team 😎
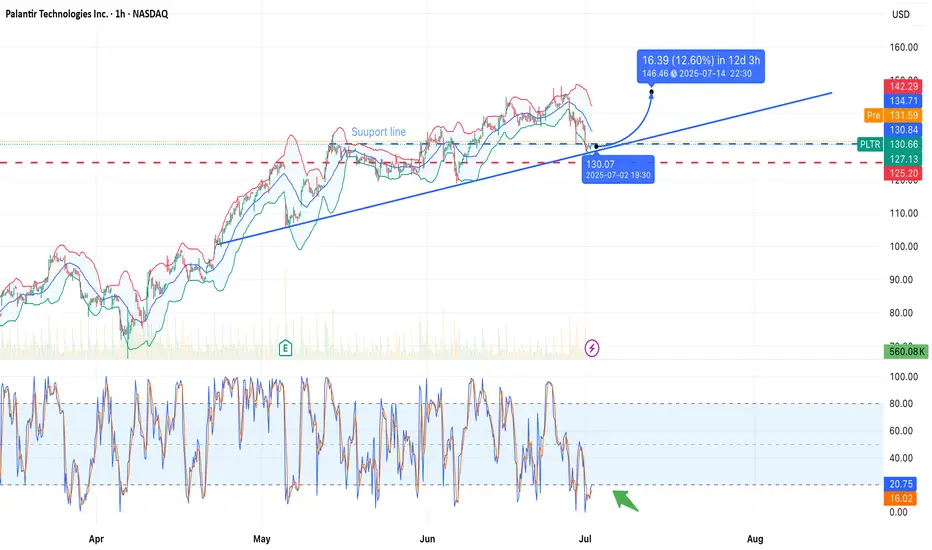
Palantir Technologies (PLTR) — Bounce in Progress?NASDAQ:PLTR is testing a long-term ascending trendline near the $128.79 level, which also aligns with a horizontal support zone. A potential rebound is forming with a projected move toward $145.94 — a +13.32% gain in 12 days.
Technical Highlights:
• Support zone: $128.79 (trendline touch + horizontal level).
• Stochastic Oscillator: Deep in oversold territory — bullish crossover forming (green arrow).
• Bollinger Bands: Price pierced lower band — reversion to the mean is likely.
• Volume: Stable, with room for momentum pickup.
Targets:
• First resistance: $134.71
• Primary target: $145.94
• Stop level: below $127 (to invalidate bullish thesis)
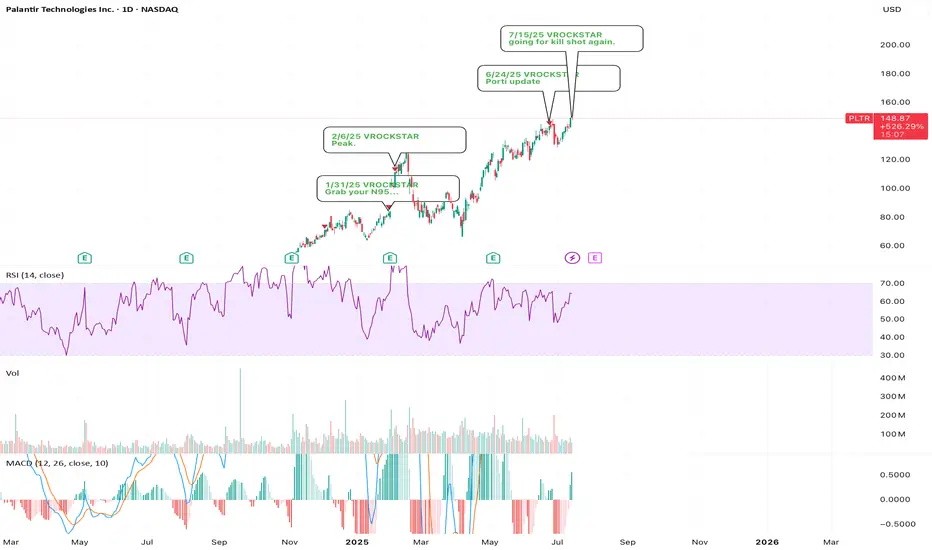
7/15/25 - $pltr - going for kill shot again.7/15/25 :: VROCKSTAR :: NASDAQ:PLTR
going for kill shot again.
- using the 2x levered meme etf PTIR to buy P's
- there are no logical explanations anymore for me to justify valuation "yeah V valuation doesn't matter"... you'll see what i mean, kid
- even 2x'ing FCF over the next 2 yrs and this thing with decelerating growth and the emergence of super intelligence means more competition, more vendors... again "you'll see kid"
- so does this go down tmr idk idc. this is a great hedge on my long book and it's done in a way where i'll roll it, pull it off, whatever.. it's not a core position in any capacity
- but it's already looking weak
- good luck holding this thing up. it wants to reset lower before it can make new highs is my armchair take (and tbh, this is secondary in my process anyway vs. the guys who just draw lines and "trust me bro" energy -- gl w that)
V
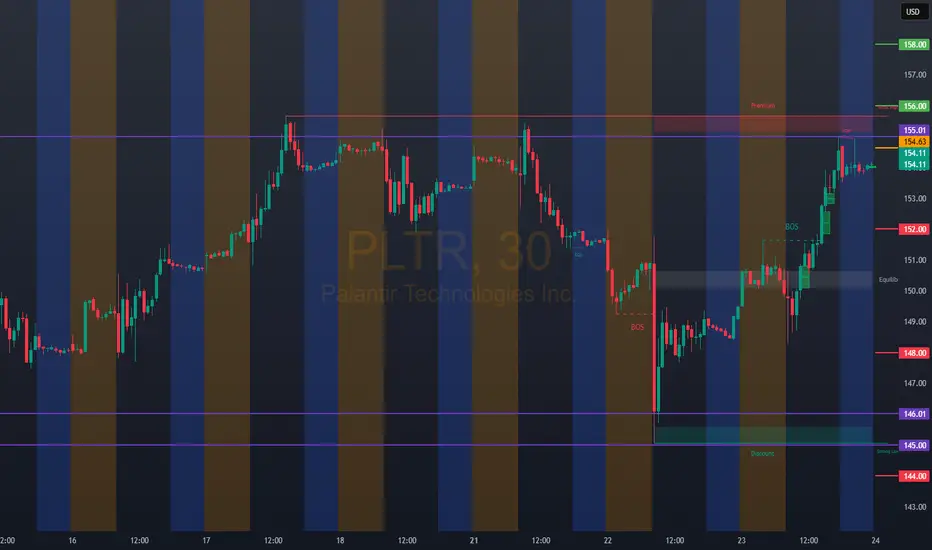
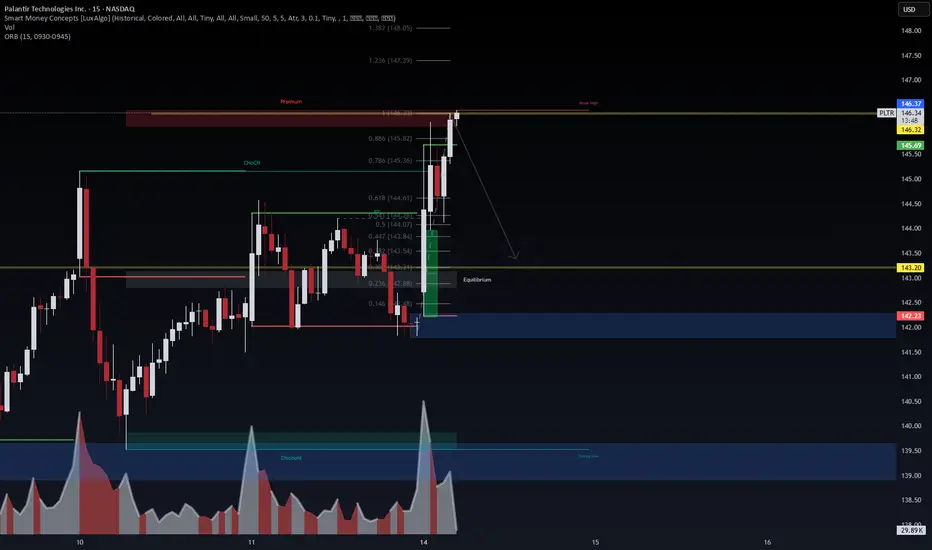
PLTR: Trend Analysis 📈 PLTR | SMC Trend Continuation or Reversal? Watch This Key Zone
🔍 Chart Type: 15m
🧠 Strategy: Smart Money Concepts (LuxAlgo), EMA Stack (20/50/100/200)
📊 Volume Surge: 177.99K
🧭 Narrative: Institutional Accumulation + Premium Rejection
🚨 Current Price: $145.88
📍 Market Structure:
Price is currently reacting from a Premium Zone just above a recent Break of Structure (BoS).
We've seen a Chg of Character (ChgofCHoCH) and several bullish BoS confirming smart money intent.
Volume expansion at the highs suggests potential liquidity grab.
📐 Key Levels:
Premium Zone near $146
Equilibrium at ~$143
Discount Zone begins near $140
Strong Edge (deep discount) below $138
Long-term Target remains at $165.11 if bullish channel is respected.
📉 Bearish Scenario:
Break below Equilibrium and retest of Discount Zone = liquidity sweep
Watch if price retraces toward $140.10 (blue line) or lower for a higher-probability long.
📈 Bullish Scenario:
Break above current swing high confirms expansion toward $152+ and eventually $165.11
EMA stack remains bullishly aligned → trending continuation likely unless broken with momentum.
🔎 Institutional Insight:
Smart Money is likely building positions below equilibrium before major continuation. Liquidity pockets between $138–$140 are prime zones for potential long entries.
📆 Watchlist Catalyst:
Earnings cycle or Palantir federal contract news could align with breakout.
🧠 VolanX DSS Rating: BULLISH BIAS
✅ Structure: Bullish
✅ Volume: High
✅ Liquidity: Grabbed above recent highs
⛔ Confirmation: Await premium rejection or retrace to discount
—
🔁 Executed via VolanX Scanner + WaverVanir DSS
📊 Trade the future. Protect the edge. Lead with intelligence.
#WaverVanir #PLTR #SmartMoneyConcepts #VolumeProfile #MarketStructure #TechnicalAnalysis #VolanX #InstitutionalTrading #QuantFinance #TradingEdge #PropTrading

PLTR - Premium Rejection Detected | Bearish Flow Confirms Put🧠 WaverVanir DSS | 15-min SMC x Options Flow x Liquidity
Palantir ( NASDAQ:PLTR ) has just tapped the 0.886–1.0 Fibonacci zone inside the Premium zone near $146.32, where price wicked above the weak high. This aligns with key liquidity exhaustion, suggesting a short-term distribution phase.
Meanwhile, our scanner picked up notable $144 Puts expiring July 18:
🧾 3,500 contracts traded with IV at 80.4%
🔁 Volume > OI → fresh bearish positioning
📉 $2.76 premium → traders paying up to hedge downside risk
🧩 Trade Breakdown:
Price action: Smart Money Premium rejection from $146.32 with reversal wick
Volume: Spike into imbalance zone below $143.20 = next probable draw
Options Flow: Bearish bets on $144 puts line up with chart thesis
ORB (9:30–9:45): High at $145.69, rejected cleanly at structure
🧭 Target Zone: $142.23 (discount block)
🚨 Risk Level: Above $146.50 invalidates short idea
PLTR at a Decision Point! for July 14GEX Walls and Wedge Breakdown Incoming?
🔸 GEX (Gamma Exposure) Breakdown for PLTR:
* Current Price: $141.99
* Key Gamma Resistance Zones:
* 📍 $145.15 – Highest Net Positive GEX (Gamma Wall)
* $144.58 – 2nd CALL Wall
* $146 – Overhead resistance from 2nd wall cluster
* Key Gamma Support Zones:
* $137 – HVL & 1st Put Layer
* $135 – 2nd Put Wall
* $132 – 3rd Put Wall
* $128.51 – GEX Low & Major Put Support
GEX Sentiment:
IVR: 39.3 (moderate)
IVx avg: 66.1
Options Flow Bias: CALL$ 56.7% – Slightly bullish
📈 Options Trade Strategy Based on GEX Zones:
🔹 Scenario A – Rejection from $145.15 (Most Probable):
* Bearish PUT Spread Play:
* Buy: $142.5 PUT
* Sell: $137 PUT (exp 7/19)
* Risk/Reward: Balanced downside toward HVL
* Trigger: If price stays below $142.5 and fails to reclaim $144.58
🔹 Scenario B – Breakout Above $145.15:
* Bullish CALL Play (speculative):
* Buy: $147.5 or $150 CALL
* Target: $155 (GEX9 zone)
* Only if: Price closes strongly above $145.5 on volume
🔸 GEX Outlook Summary:
* Upside capped at $146–$150 unless breakout volume enters
* Downside path to $135 / $132 is smoother if $140 breaks
* Gamma squeeze unlikely unless > $146
🧠 1-Hour Price Action & Intraday Trading Setup
⚙️ Market Structure:
* Trendline Support: Holding from recent rally
* CHoCH formed below resistance, suggesting a potential reversal
* BOS zone near $142.5–$144.6 creating supply
* Rising wedge breakdown forming
📊 Key Zones:
* Support: $140.53 (ascending trendline), then $137 (HVL)
* Resistance: $142.5 → $144.58 → $145.15
* Bearish Bias: As long as price is below $144.6
📉 Intraday Trading Plan (1H)
🔻 Short Setup:
* Entry: If price breaks below $140.50 with momentum
* TP1: $137
* TP2: $135
* Stop Loss: Above $144.60
🔼 Reversal Long (Less Probable):
* Entry: Break and hold above $145.15
* TP: $149.5 → $155
* SL: Below $143.5
🧭 Summary Thoughts:
* PLTR is sitting below strong GEX resistance with rising wedge weakness.
* Bearish structure forming unless bulls reclaim $145+ quickly.
* Favor PUT plays targeting $137–$135 unless breakout proves otherwise.
Disclaimer: This analysis is for educational purposes only and does not constitute financial advice. Always manage risk and do your own due diligence before trading.

PLTR - Palantir Technologies: Why PLTR is the Perfect PlayExceptional Performance Leadership
Palantir Technologies has established itself as the undisputed champion of the U.S. stock market in 2025. The stock has delivered extraordinary returns of 402.92% over the past 12 months and 87.89% year-to-date, making it the best-performing stock in both the S&P 500 and Nasdaq-100 indices. Currently trading at $142.10, the stock has surged from lows around $21, representing one of the most dramatic momentum plays in modern market history.
Powerful AI-Driven Revenue Growth
The company's financial performance has been nothing short of spectacular. Palantir's U.S. commercial AIP (Artificial Intelligence Platform) revenue has surpassed a $1 billion annual run rate with 71% year-over-year growth. The company reported Q1 2025 revenue of $883.86 million, beating consensus estimates and growing 39% year-over-year. This growth trajectory is being driven by unprecedented demand for AI solutions across both commercial and government sectors.
The company's customer base has expanded to 769 total customers, up 39% year-over-year, with 44% of revenue now coming from commercial clients. This diversification away from pure government dependency represents a significant strategic achievement that provides multiple growth vectors.
Strategic Government AI Dominance
Maven Smart System Contract Expansion
Palantir's government business has reached new heights with its Maven Smart System contract being increased by $795 million, bringing the total value to over $1.3 billion through 2029. Pentagon leaders boosted the contract citing "growing demand" for the system across all military branches, including the Army, Navy, Air Force, Space Force, and Marine Corps.
Stargate AI Initiative Leadership
The company holds a central position in the $500 billion Stargate AI infrastructure project, positioning it as a backbone for America's AI future. This initiative represents one of the largest technological undertakings in U.S. history, designed to establish domestic AI superiority and reduce reliance on foreign systems.
Strategic Partnerships
Palantir has formed landmark partnerships with Microsoft for classified AI deployment and Accenture Federal Services for comprehensive government AI implementation. These alliances significantly expand the company's reach and delivery capabilities across the federal ecosystem.
Technical Momentum Confirmation
Bullish Technical Setup
The stock exhibits exceptional technical strength with multiple confirmation signals:
Moving Average Alignment : All major moving averages (20-day, 50-day, 200-day) are positioned bullishly below the current price, indicating sustained upward momentum
RSI Positioning: At 58.42, the RSI shows healthy momentum without being overbought, providing room for continued advancement
Volume Confirmation: Recent trading volumes have consistently exceeded 50 million shares daily, indicating strong institutional participation
Golden Cross Pattern: The 50-day moving average at $131.9 remains above the 200-day moving average at $101.7, confirming the bullish trend
Breakout Pattern
The stock has successfully broken above the $140 resistance level with strong volume, targeting the $175-$220 range based on technical analysis. The pennant pattern breakout above $140 has been confirmed by institutional buying pressure and retail momentum.
Institutional Investment Surge
Record Institutional Participation
Institutional ownership has reached 45.65% of outstanding shares, with $19.19 billion in institutional inflows over the past 12 months versus only $10.43 billion in outflows. This represents a net institutional buying pressure of nearly $9 billion, demonstrating strong professional investor confidence.
Premium Analyst Coverage
Wedbush Securities has raised its price target to $160, calling Palantir the "Messi of AI" and positioning it as a top pick in their "IVES AI 30" list. The firm sees Palantir's AIP platform as foundational for the trillion-dollar AI spending wave and believes the company has a "golden path to become the next Oracle".
Competitive Advantages and Market Position
Architecture-Agnostic Platform
Palantir's AIP is architecture-agnostic, seamlessly integrating with both centralized cloud systems and decentralized frameworks. This versatility allows the company to serve diverse client needs across multiple sectors, from government defense to commercial healthcare.
Network Effects and Data Flywheel
The company benefits from powerful network effects where more customers generate more data, which improves AI models and increases retention rates. This creates a self-reinforcing competitive advantage that becomes stronger over time.
Government Moats
Palantir's deep government relationships and security clearances create substantial barriers to entry. Multi-year government contracts provide revenue stability and growth visibility that few technology companies can match.
Financial Strength and Profitability
The company has demonstrated seven consecutive quarters of GAAP profitability with expanding margins. Adjusted operating margins have improved to 36% in Q1 2025 from 29% previously, showing operational excellence alongside revenue growth. The company maintains a strong balance sheet with $4 billion in cash and equivalents.
Investment Thesis Summary
Palantir Technologies represents the perfect convergence of momentum, fundamentals, and catalysts that defines exceptional investment opportunities:
Momentum Factors:
402.92% twelve-month returns leading all major indices
Continuous institutional accumulation with $9 billion net inflows
Technical breakout above key resistance with volume confirmation
Fundamental Catalysts:
$1 billion+ AIP commercial revenue run rate with 71% growth
$1.3 billion+ government contract pipeline expansion
Central role in $500 billion Stargate AI infrastructure initiative
Strategic Positioning:
Architecture-agnostic platform creating multiple market opportunities
Government relationships providing defensive moats and growth visibility
Network effects and data flywheel creating competitive advantages
Risk-Adjusted Opportunity:
Clear support levels at $137-$140 range providing defined risk parameters
Multiple price targets ranging from $155-$220 suggesting significant upside potential
Strong balance sheet and cash generation providing downside protection
Palantir Technologies embodies the rare combination of explosive growth, defensive positioning, and strategic importance that creates generational investment opportunities. The company's leadership in AI government applications, combined with accelerating commercial adoption, positions it as a cornerstone holding for the AI revolution.

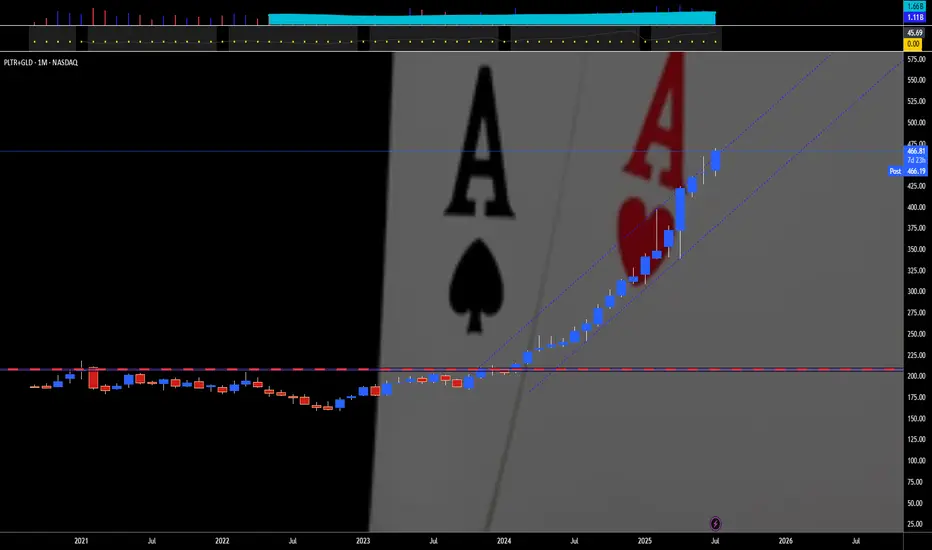
PALANTIR PLUS GOLD — TWO IS A PAIR"Two is a pair" means that the number two represents a set of two identical or closely related items that are used together or considered a unit. For example, a pair of socks, a pair of shoes, or a pair of gloves. It can also refer to two people, animals, or things that are grouped together.
Here's a more detailed breakdown:
Definition:
A pair is a set of two things that are alike, matched, or intended to be used together.
Examples:
"A pair of socks" - two socks designed to be worn on the feet.
"A pair of scissors" - two blades joined together.
"A pair of lovers" - two people romantically involved.
Singular/Plural:
The word "pair" can be singular or plural, depending on how it's used. For example: "This pair is comfortable" (singular) and "These two pairs are comfortable" (plural).
Relationship:
While "pair" often implies a strong connection or matching nature, it can also be used for things that are simply grouped together.
For example, like Palantir NASDAQ:PLTR & Gold AMEX:GLD that match each other, for 18 straight months in a row. 💖
--
Best wishes,
@PandorraResearch Team
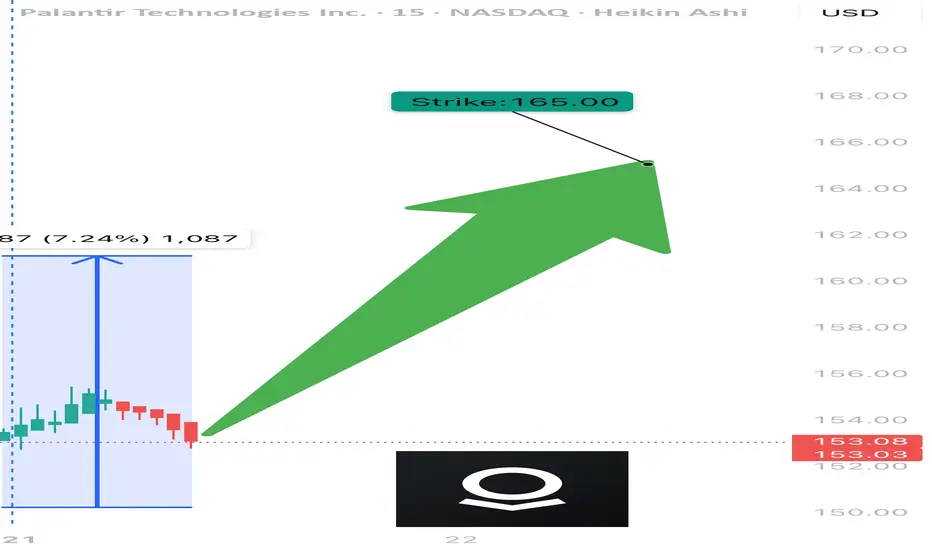
PLTR WEEKLY OPTIONS TRADE IDEA – JULY 21, 2025
🔥 NASDAQ:PLTR WEEKLY OPTIONS TRADE IDEA – JULY 21, 2025 🔥
Bullish Momentum + Strong Options Flow = Prime Setup 📈
⸻
📊 TRADE SETUP
🎯 Instrument: NASDAQ:PLTR
📈 Direction: CALL (LONG)
💵 Strike Price: $165.00
🟢 Entry Price: $0.59
🛑 Stop Loss: $0.30 (50% risk cap)
🎯 Profit Target: $1.18 (2x reward)
📅 Expiry: July 25, 2025 (Weekly)
📏 Size: 1 contract
💪 Confidence: 75%
⏰ Entry Timing: Market Open
⸻
📌 Why This Trade?
✅ RSI Strength: Daily RSI = 71.0 | Weekly RSI = 75.3 → Bullish continuation
✅ Weekly Range Positioning: Trading at 96.6% of weekly high
✅ Options Flow: Call/Put ratio = 1.47 — institutional bullish bias
✅ Strike Interest: Heavy OI @ $162.50 & $165.00 = strong magnet zones
🟡 VIX = 16.6 → Favorable volatility for short-term premium plays
⚠️ Volume is flat (1.0x) — no surge confirmation, so keep stops tight
⸻
🧠 Execution Plan
• Open position at the bell
• Mental stop at -50%, or ~$0.30
• Target 100% return = ~$1.18
• Exit ahead of Friday’s expiration unless the trade hits target early
⸻
💡 Key Levels to Watch
🔹 Resistance Zone: $155.68 – $156.59
🔹 Support Watch: Below $152 could break structure
🔹 Earnings Risk: Check calendar — volatility can spike unexpectedly
⸻
🏁 Verdict
• Momentum = 🔥
• Flow = 🚀
• Volume = 😐
➡️ Net Bias: MODERATE BULLISH — Risk-managed call with solid R:R
⸻
NASDAQ:PLTR Call @ $165 — Entry $0.59 → Risk $0.30 → Target $1.18 💥
Clean setup for disciplined bulls. Don’t overstay. Ride momentum. 🎯
⸻
#PLTR #OptionsTrading #WeeklyOptions #MomentumPlay #CallOptions #FlowTrade #TradingView #StockSignals #TradeSetup #RiskReward #SwingTrade #SmartMoneyFlow
PLTR Trade Update – July 11, 2025📅
PLTR held the breakout like a champ. ✅ After a clean move through the triangle resistance yesterday, today’s price action continues to build strength above $142.50.
🔼 Bulls are in control, riding the momentum with higher lows and tight consolidation near breakout levels.
🎯 Targets remain firm at $144.05 and $146.04.
🛡️ Stop-loss still protected below $139.76 — trade remains active and technically strong.
The structure is bullish, volume supports the trend, and PLTR could be gearing up for the next leg higher. Watching closely for a push into resistance zones.
🔍 Strategy: Breakout Continuation
📊 Sentiment: Bullish & Confident
💡 Holding long — eyes on the volume and breakout follow-through.

PLTR: Sell ideaSell idea on PLTR as you can see on the chart if and only if we have the breakout with force
the Belkhayate Iceberg, the vwap and the support line by the sellers.
