PLTRD trade ideas


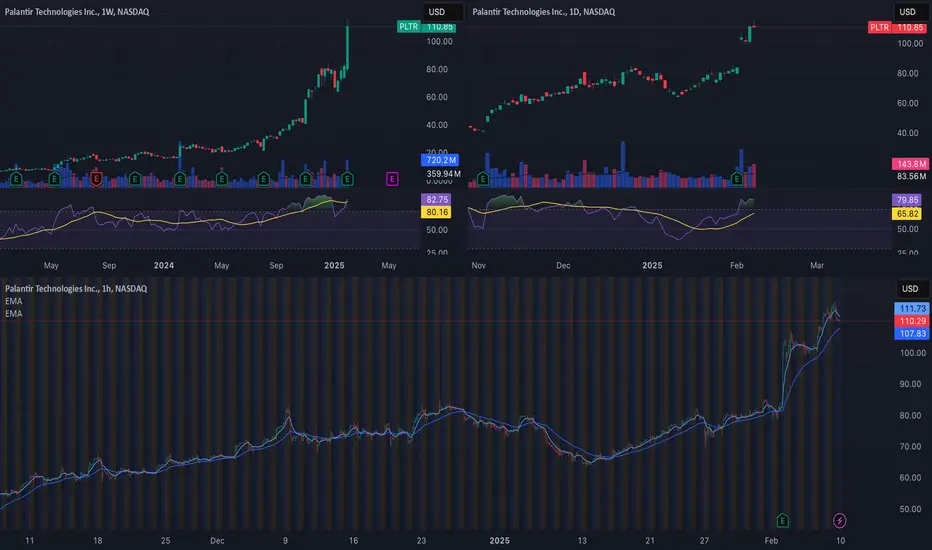
Palantir 2-17 (scalping + forecast)🔥 Market Overview:
Trend: Palantir (PLTR) is in a strong bullish uptrend, making new highs but showing signs of exhaustion near resistance.
Key Levels:
Resistance: $120–$125 (recent highs, potential breakout zone).
Support: $114–$115 (Supertrend support).
Indicators:
EMA 9: $118.50 (acting as dynamic support).
EMA 200: $92.74 (long-term uptrend intact).
Supertrend: $114.39 (key level for trend continuation).
MACD: Losing momentum, signaling possible consolidation.
RSI: 63.06 (bullish but nearing overbought levels).
🔥 Scalping Strategy:
🩸 1. Momentum Scalping:
Buy near: $115–$118 on pullbacks.
Target: $122–$125.
Stop-loss below: $112.
🩸 2. Breakout Scalping:
Long if price breaks above: $120, targeting $125+.
Short if price rejects $120, targeting $115.
🩸 3. Range Scalping:
Sell near: $120–$125 resistance.
Target: $115–$112.
Stop-loss: $126 if breakout occurs.
🔥 Mid-Term Trend Forecast (1-3 Weeks):
If PLTR breaks $120, expect a push toward $125–$130.
A rejection at $120 could lead to profit-taking, pushing the stock back toward $115–$112.
RSI is approaching overbought levels, meaning short-term volatility is expected.
🔥 News & Market Context:
AI & Government Contracts: Palantir’s role in AI-driven analytics keeps fueling investor demand.
Tech Sector Momentum: The entire AI sector is on fire, but profit-taking risk remains high.
Macroeconomic Factors: Interest rate concerns could trigger sector-wide slowdowns.
🔥 Decision:
🩸 Short-term: Scalp long near $115 or on a breakout above $120.
🩸 Mid-term: Bullish, but extended—watch for consolidation before another move.
🩸 Ideal Play: Buy on dips or wait for a breakout confirmation above $120.
👑 Final Verdict: Palantir remains one of the hottest AI stocks, but profit-taking risk is increasing. Bulls need to clear $120 to maintain momentum.
🔥 LucanInvestor's Quote: "The strongest trends don’t last forever—know when to hold and when to cash in."

Bullish on PLTR: Capitalize on Momentum Amid Strong Fundamentals
- Key Insights: Palantir Technologies continues to leverage its solid
performance in the AI and defense sectors, backed by strategic partnerships
and robust government contracts. The growth trajectory remains positive, but
caution around high stock valuations should be observed.
Price Targets: For next week: T1 at 123, T2 at 126.
For stop levels: S1 at 116, S2 at 114.
- Recent Performance: PLTR's stock is currently priced at 119.16, reflecting a
strong uptrend with potential further gains if it breaks through resistance
levels. The stock has recently reached an all-time high amidst growing
investor interest.
- Expert Analysis: Analysts express a generally bullish sentiment on Palantir's
growth, citing a strategic advantage in the burgeoning AI market. However,
some are wary of the elevated valuations that could impact investment
attractiveness in the near term.
- News Impact: Recent headlines highlight Palantir's substantial contract wins,
including a $480 million agreement with the US Department of Defense. These
contracts reinforce its pivotal role in technology provision amid
international security issues and add to its market credibility.

PLTR Hitting Rounding Bottom 2x TargetWeekly chart - Long term view
PLTR is hittin 2x Rounding Bottom Target at 121.
Buy signal triggers in Jan 2023. There's still no sell signal till now.
MCDX Buying volume still strong.
Support at gap close 82, Psychological level at 100.
Hold. Looking to further buy if there's signal at 82 or 100.


PLTR Ready for a Massive Breakout!Palantir Technologies (PLTR) has been steadily climbing within an ascending channel, and we are now approaching a key breakout level. The stock has been showing strong momentum, with higher highs and higher lows forming a bullish structure.
🔍 Technical Analysis:
✅ Trend: PLTR has been riding the upper trendline of the ascending channel. If it breaks above, we could see an explosive move.
✅ Volume: Increasing volume indicates strong buyer interest, suggesting accumulation before a breakout.
✅ Indicators: The momentum oscillator is reaching bullish territory, aligning with the breakout thesis.
✅ Support Levels: Holding above $100 is crucial, with strong support around $93.
✅ Resistance: Key breakout zone sits around $120-$125—once cleared, PLTR could skyrocket.
📈 My Trading Plan:
🎯 Target: $140+ in the next few weeks.
🛑 Stop-Loss: Below $100 to protect against downside risk.
🔄 Strategy: Waiting for confirmation above $120 with strong volume before entering.
💡 Conclusion: The risk-reward ratio looks favorable here, and all signs point to PLTR making a big move. A confirmed breakout could open the gates to new highs! 🚀🔥

Overvalued insider tradeRelative valuation appears significantly inflated compared to peers. A more justifiable valuation would be in the vicinity of 90, with a target of 95 anticipated by next month. Even considering favorable political tailwinds, the current trajectory seems unsustainable, potentially reaching 120 before retracing.

Short PLTR at $118 and when it breakdown this patternYesterday I was wrong typo when call the Bearish Flag is a Rising Wedge, new update today to share you guys my trade plans.
I'm hold a Long Put strike $118 and will open another Long Put strike $115 when PLTR breakdown the bottom trendline.
Exp 3/21/2025.
Cut loss when it run over $120 - $121.
Disclaimer

Just Shorted Palantir, PLTRI believe in AI in warfare etc... I think Palantir is promising company, I invested in Palantir when the price was around 7$.. I sold it around 18$...
This is just trading for me.
I bought handfull amount of Put options.
Lets see how it goes...
Of course not an investment advice do your own analysis.

PLTR will hit $120 before end of weekTechnical Indicators:
Moving Averages: PLTR's current price of $117.39 is well above its 20-day exponential moving average (EMA) of $89.64 and its 50-day EMA of $77.87, indicating a strong upward trend.
TIPRANKS.COM
Relative Strength Index (RSI): The RSI stands at 82.13, placing the stock in overbought territory. While this typically signals potential for a pullback, it can also indicate sustained buying pressure in a strong uptrend.
TIPRANKS.COM
MACD: The Moving Average Convergence Divergence (MACD) is at 9.88, which is generally interpreted as a bearish signal. However, in the context of the current strong uptrend, this may reflect short-term consolidation rather than a reversal.
TIPRANKS.COM
Chart Patterns:
PLTR recently broke out from an ascending triangle pattern, a bullish continuation signal, suggesting potential for further gains.
INVESTOPEDIA.COM
Options Market Activity:
As of February 10, 2025, PLTR options exhibit an implied volatility (IV) of 63.64% with an IV rank of 54.13%, and a volume of 2,075,887 contracts, which is 274.23% of the average daily volume.
OPTIONCHARTS.IO
This heightened activity indicates increased trader interest, often associated with expectations of significant price movements.
Conclusion:
The convergence of these technical factors—strong performance above key moving averages, bullish chart patterns, and elevated options activity—suggests that PLTR is poised to close the week with strength in the options market.
I think things will get choppy in the near future,but momentum should take us over $120. For how long, I do not know.
Also, this is no means advice, this is my opinion.
THUNDER

$PLTR ready for a move (to the downside IMO)Clear squeeze setup forming at ATH after massive post-earnings momentum. Volume steadily declining over 5 days with significant volatility contraction. BB-KC squeeze (green bands compressing within Keltner) typically precedes major directional move.
Bearish thesis:
- Overbought conditions
- Volume decline
- Multiple timeframe squeeze potential
- Rich valuations
Trade plan if bearish break:
- Call credit spread above ATH wick
- Leveraged inverse ETF position
- Entries on volume confirmation + EMA breaks
- Stops: Above EMAs (if broken) or ATH (if holding)
Watching 4H/1D charts for squeeze alignment. Key trigger = strong red candle + volume spike.
⚠️ Risk management is critical here. Despite bearish setup, never underestimate bull market psychology on momentum names.
Position size accordingly. No trade is guaranteed.
#Trading #TechnicalAnalysis #PLTR
(Not financial advice - DYOR)


PLTRAudio Analysis: notebooklm.google.com
Below is an **integrated Fundamental and Technical Analysis** report on Palantir Technologies (PLTR), with a particular focus on the **bear case** and considerations for a **short sell** opportunity. Please note this is a **professional-level overview** intended for the trading floor manager, drawing upon both the high-level fundamentals and recent technical signals.
---
## 1. **Fundamental Analysis Recap**
1. **Sky-High Valuation Multiples**
- **Trailing P/E**: ~583×, which is extremely elevated versus historical and industry norms.
- **Forward P/E**: ~200× (based on ~$0.55 forward EPS), still far above typical high-growth tech peers and well beyond the ~20× S&P 500 average forward P/E.
- **Price/Sales**: ~87×, highlighting that revenue growth needs to stay exceptionally strong to justify current levels.
2. **Growth & Profitability**
- **Revenue Growth**: Q4 2024 revenue up 36% YoY; 2025 guidance at ~$3.75B (+31% YoY).
- **Margins**: Net margin around 18%—solid, but not extraordinary enough to sustain a 200× P/E if growth slows.
3. **Market Expectations & Analyst Targets**
- Consensus 12-month price target near $69–$70 implies ~37% downside from current levels ($110+).
- Stock price incorporates **aggressive AI-driven growth assumptions**, meaning any miss on guidance or shift in sentiment could trigger multiple compression.
4. **Overreliance on AI Hype**
- Palantir is benefiting from enthusiasm around its AI platform (AIP). Overreliance on a single narrative can inflate valuations—if the AI hype fades or competition intensifies, shares may correct sharply.
**Key Bearish Fundamental Takeaway**: **PLTR’s valuation appears stretched** relative to both broad market metrics and even other high-growth tech names. While growth remains robust, the current price suggests *near-flawless* execution for many years, creating a higher risk of a downside re-rating if sentiment changes.
---
## 2. **Technical Analysis Summary**
1. **Weekly Chart**
- **Extended Uptrend**: Price has risen parabolically, with weekly RSI above 80 (signaling overbought conditions).
- **Volume**: Surging volumes indicate strong buying, but watch for a volume spike on any significant down week, which could confirm selling pressure.
2. **Daily Chart**
- **Overbought Momentum**: Daily RSI also hovers in the high-70s to low-80s range—historically prone to consolidation or pullbacks.
- **Elevated Price vs. Moving Averages**: The stock is trading well above the 10-day and 20-day MAs. A break below these short-term MAs often triggers momentum traders to exit.
3. **Intraday (1-Hour) Chart**
- **Sharp Run-Up**: Price has advanced rapidly, with minimal pauses.
- **Profit-Taking Signs**: Slight cooling in the 1-hour RSI and the formation of small-bodied candles with upper wicks, hinting at short-term distribution or indecision.
**Key Bearish Technical Takeaway**: PLTR appears **technically overextended** in multiple timeframes. This increases the likelihood of a pullback or correction, especially if broader market sentiment towards high-multiple stocks worsens.
---
## 3. **Bear Case Rationale**
1. **Valuation Compression Risk**
- With P/E > 200× forward earnings, even a moderate downward revision in growth expectations could spur multiple contraction—potentially sending the stock sharply lower.
2. **Overbought Technicals**
- Weekly and daily RSIs in the 80s are historically unsustainable. Overbought conditions often precede consolidations or corrections, providing a window for short sellers to capitalize.
3. **Macro Factors & Rising Rates**
- Growth stocks with high valuations are particularly sensitive to interest rates. Any hint of tighter monetary policy can diminish risk appetite for stocks priced at extreme multiples.
4. **Analyst & Institutional Rotation**
- If institutional investors choose to rotate out of high-growth, high-valuation names into more defensive sectors, PLTR could see accelerated selling.
- The stated 12-month analyst consensus target implies substantial downside, suggesting limited support from the sell-side in the near term.
5. **AI Hype Vulnerability**
- Overreliance on an AI-driven narrative can be a double-edged sword. In the event that AI adoption or contract wins slow, the stock might face a severe revaluation.
---
## 4. **Potential Short-Sell Setups**
Below are two illustrative ways a short-seller might engage, each with varying risk levels:
1. **Momentum Shift Entry**
- **Trigger**: Wait for price to close below the 10-day or 20-day moving average on the daily chart with a confirmed pickup in sell volume.
- **Stop-Loss Consideration**: Place stops above the recent swing high (e.g., above $116–$120) to protect from a short squeeze if the bullish run persists.
- **Target Zones**: A price retracement toward the $90–$95 area (recent pivot/support) or the round number $100 could be initial downside targets.
2. **Rally Fade / Overbought Condition**
- **Trigger**: Enter a short position into a relief bounce back toward the prior highs if momentum indicators show a clear negative divergence (e.g., RSI making lower highs).
- **Stop-Loss Placement**: Just above the new local high—if price unexpectedly breaks higher, exit quickly.
- **Target Zones**: Scale out partial profits around the 50-day MA or psychological levels like $100. If broader market conditions worsen, a deeper move below $90 could be possible.
**Risk Management**: Shorting a high-momentum, high-volatility stock is inherently risky. Tight stops, position sizing, and continuous monitoring are essential. **Cover** promptly if price action contradicts the bearish thesis.
---
## 5. **Conclusion & Manager Summary**
**Fundamental Snapshot**:
- Palantir’s valuation is pricing in extraordinary future growth (P/E > 200× forward). Any slowdown or miss may induce significant downside.
- Analysts are cautious; consensus targets are below current price.
**Technical Situation**:
- Price is extended across multiple timeframes, with **overbought RSI** readings and a near-vertical price trajectory—historically indicative of potential pullbacks.
- A correction to technical support (near $100, or possibly $90–$95) may be in the cards if bullish momentum wanes.
**Bear Thesis / Short Opportunity**:
- **Rationale**: Extreme valuation + Overbought technicals + Potential macro headwinds = Elevated risk of a downside re-rating.
- **Strategy**: Look for a shift in short-term momentum (closing below key moving averages) or negative RSI divergence as a **potential short entry** signal. Set stops carefully above recent highs to cap losses.
Given the stock’s **hyper-bullish** sentiment, timing is crucial. If bullish momentum persists longer than expected, short positions risk facing quick squeezes. Nonetheless, the **probability of a meaningful correction** grows with each new leg higher, offering an appealing **risk/reward** profile for experienced traders prepared to manage volatility.
---
### **Final Note**
This combined **Fundamental + Technical** perspective suggests **caution** for long investors at these elevated levels and **potential opportunity** for short sellers anticipating a reversion to more sustainable valuation metrics. Proper risk controls—such as **position sizing, stop-loss orders, and regular re-evaluation** of the thesis—remain paramount.

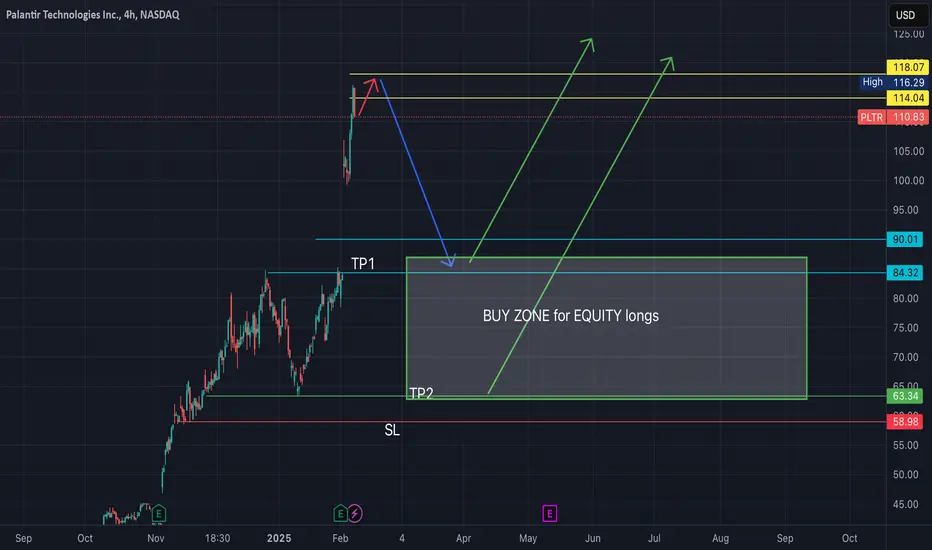
PLTR -- more volatility forecasted into MarchExpecting quick progression to 118$ level as final buy-side wave near term.
Looking for renewed significant selling action from that level to retrace price back to pre-earnings levels near 80-85$
Possibility exists (imho) that we fully retrace back to 63-64$ levels by April timeframe, depending on sentiment as we head into next FOMC meeting in mid-March.
After that, my cycles analysis indicates we will continue higher toward 120...Therefore, I will be planning on taking profits on put option contracts once underlying share price reaches below 85$, and will plan on scaling into long equity positions on discounts between 64-85$ for the projected subsequent buy wave to 120+


PLTR will get pounded! Been warnedPLTR increasing at a decreasing rate thanks to short squeeze (fake demand). They are so surprised that insiders are selling like crazy. If you're holding, sell, don't short as you could get squeezed and could be expensive. By next week this will dip 20-30% IMHO. PLTD to take advantage of this set-up!
Best of luck and always do your own due diligence!

PLTR - LONGI am hoping that this down day on QQQ is short lived and that we ultimately close above all the prior 4 days lows , that's a key detail . We are three legs down on QQQ 5 min though and I think we going up , so I added a share of PLTR as my dip buy .....
This may be one of the best things to own right now ....
Just a share , I've already got 2 names ( CRWD + NFLX ) from last few days . This is a 3 legs down on QQQ buy .
PLTR, has 1/2 , 2/2 gaps and eps and rev to go along with growth stock .
Tight moves , good RS so good it ignores everything else market does on red days lol .
As for the level of account risk I have with last few days stock trades I am at a potential 2.8% loss , not including beta hedge of ONON/NKE.... time to chill and let the trades tell me what to do next .... I was considering researching beta hedge options on NFLX, CRWD and PLTR .... probably won't but I will research it though to consider for future trades maybe ....
For those of you who don't know what beta hedging is ... you long one short the other , trade the spread , can collect options premiums potentially too by selling puts etc. to acquire shares . Great for trading range markets and reducing account drawdown in really good markets but potentially reduces max gain of one sided long ...
Will go through some potential beta hedges for CRWD and NFLX as homework later ...any recommendations on beta hedge ideas would we welcomed too :)
