Philip Morris International Philip Morris International STOCK PLZ FOLLOW MY TWITTER 01:21by UnknownUnicorn66209930
$PM - long, earnings 2/6 before openNYSE:PM - long, speculative play, get out before the 2/6 Earnings before market openLongby crasher4
PM Earnings play2.31 cost of spread 77.5/85 Earnings play as vaping is moving into a recession due to fears and cigarette sales may be higher. It also bounced after Altria deal fell through. Max gain will be 25% of the spread which is a sale price of $3.60 Max gain is $130. Max loss is $130Longby Synaptic724Updated 2
Phillip Morris LongSome news on an Altari (MO) merger due to poor results, - PM has hit support 5 times and bounced off, I will follow my ta and stop loss in profit , 3 quarters would be a nice holding period for this, but I may close this as soon as we get to some profit. by L-LawlietUpdated 3
PM, Philip Morris International Inc.- Head & ShouldersNYSE:PM Do you know this pattern? The so-called head and shoulders in the analysis of financial markets is an opportunity to be taken if you trade. Do you know why? It's all about math and probability. Staying on the statistical side in your favor is what creates potential financial growth, which in turn will give you time to do what you like.Longby SwissTradingSchool3
Daily PM stock price trend forecasts analysis 15-JUL Investing position: In Rising section of high profit & low risk S&D strength Trend: In the midst of an adjustment trend of downward direction box pattern price flow marked by limited rises and downward fluctuations. Today's S&D strength Flow: Supply-Demand(S&D) strength flow appropriate to the current trend. read more: www.pretiming.com Forecast D+1 Candlestick Color : RED Candlestick %D+1 Range forecast: 0.3% (HIGH) ~ -1.6% (LOW), -0.6% (CLOSE) %AVG in case of rising: 1.4% (HIGH) ~ -0.6% (LOW), 1.1% (CLOSE) %AVG in case of falling: 0.4% (HIGH) ~ -1.3% (LOW), -0.7% (CLOSE)by pretiming1
Philip Morris sell signalsPhilip Morris (PM), Daily chart: Resistance line + Bearish Engulfing candles pattern + Side of Bollinger bands (20,2) + Hidden divergence on RSI(14)Shortby Dmitry_Nikolaev334
idklooks like consolidation for another drop down, but macd is crossing and the double MA is about to, this might end up being a big U and turn around to the bull sideby Noahbla2
PM: Sort opportunityAn intraday high potential, Back Tested Sort Analysis. We ll try to enter into the correction of the uptrend movement. DETAILS ON THE CHART NOTE: Entry range area above the entry point, is calculated upon 80% of the recorded pullback back tested past performances DISCLAIMER: This is a technical analysis study, not an advice or recommendation to invest money on.Shortby TradingStatistics5
PM Bearish DivergenceBearish case: * Inverted Hammer at the top of trend + on above average volume + at resistance and + with massive bearish divergenceShortby PartTimeGenius2
PM - looks like good short term buyCould be in the middle of an ABC correction. Also this one could just take off and not come back. Given the time it took for the 5 wave impulse to complete the probability favors short term boom them bust, then new cycle to start up.Longby lemonsandshade3
$PM Buying Puts on NYSE:PM post earnings with a duration to carry through next earnings cycle. Targeting a retest of the last major low.Shortby norok2
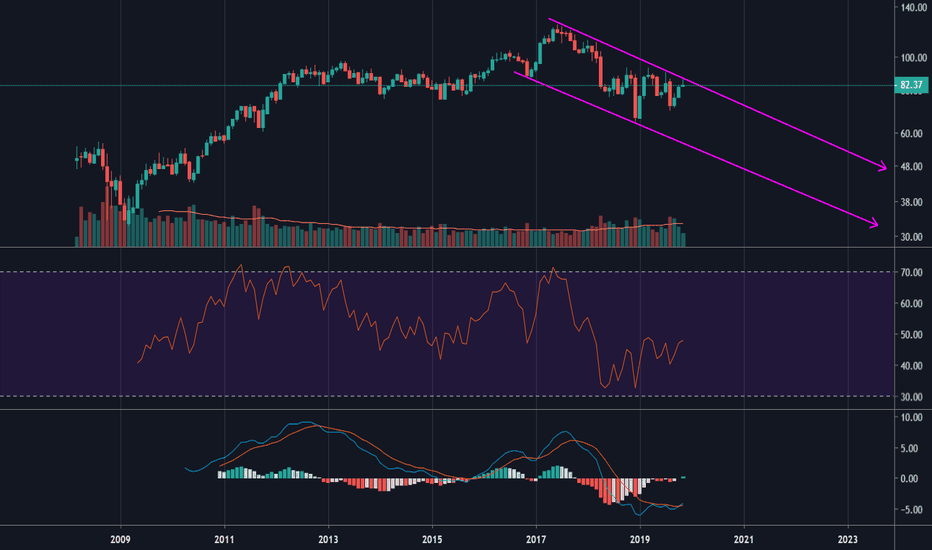
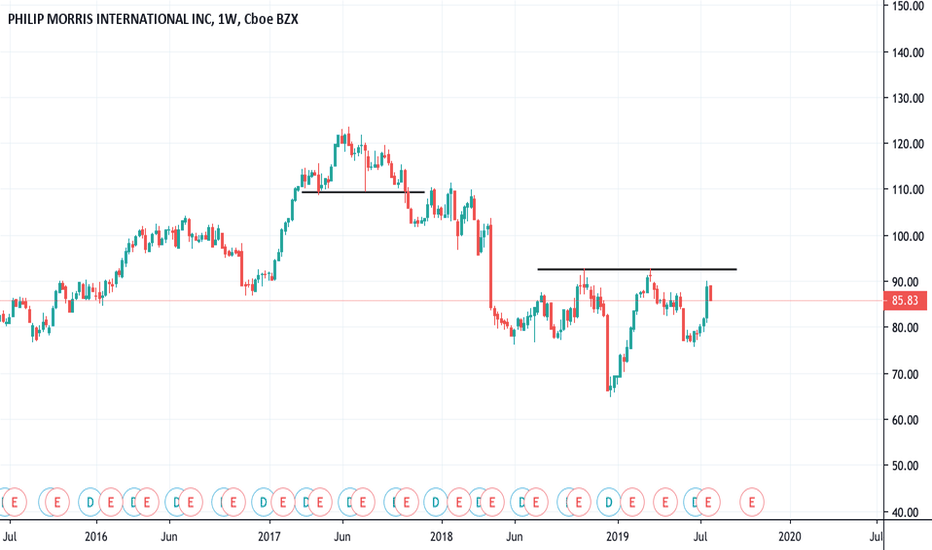
Who Smokes?Looks like a big H&S to me... Retested the neckline and got rejected... Everyone is Juuling anyways... Shortby BLZcapital1
PM: Sell the RipBTD people sometimes couldn't comprehend in there's no dip in bear market. In bear market, you trade the opposite of it.Shortby w2d20
Short term overbought on the 4hour chart Short term overbought on the 4hour chart but should present very good buying opportunity shortly after dip.Longby FriendlyFibonacci67651
Philip Morris: zigzag with bullish undertonePhilip Morris shares are ready for take-off! Support levels remained in place and upside potential is looming: $ 90+ in the short-term!Longby HamishMaertens2