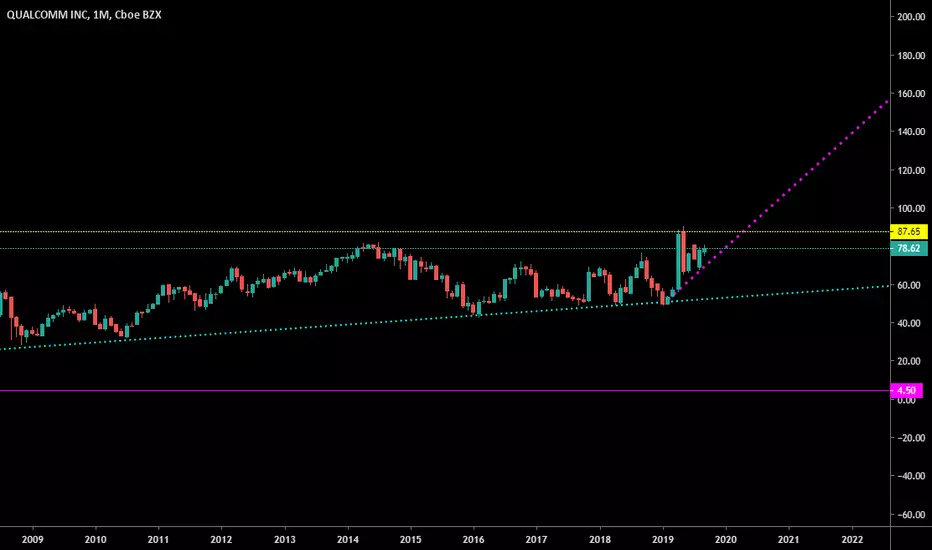
Let's get crazy bullish on QCOMLooking for yield and growth, i don't see anything better than QCOM right now. I'm seeing a 20 year phase 2 hyperwave, we could possibly be in phase 3 right now. Once the yellow overhead resistance is broken on a monthly candle i feel good about confirming the phase 3 line.
QCOMD trade ideas
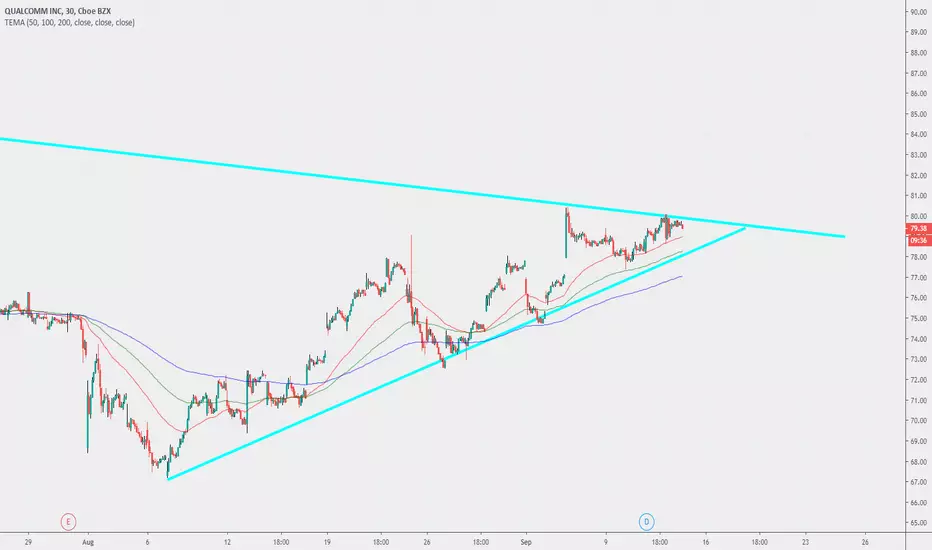
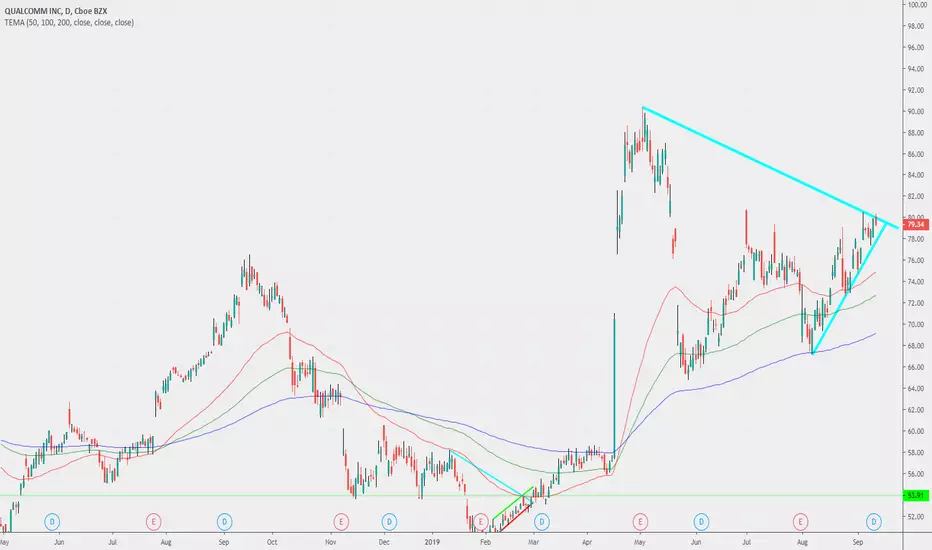
QCOM Asymmetrical TriangleQCOM is developing an Asymmetrical Triangle on the intermediate-term trend. The stock still faces previous yearly high‘s resistance.

QCOM ; Weekly Ascending Triangle formingTriangle forming over past 5 months with a potential breakout above 80.
QCOM in the strong Semiconductor sector.


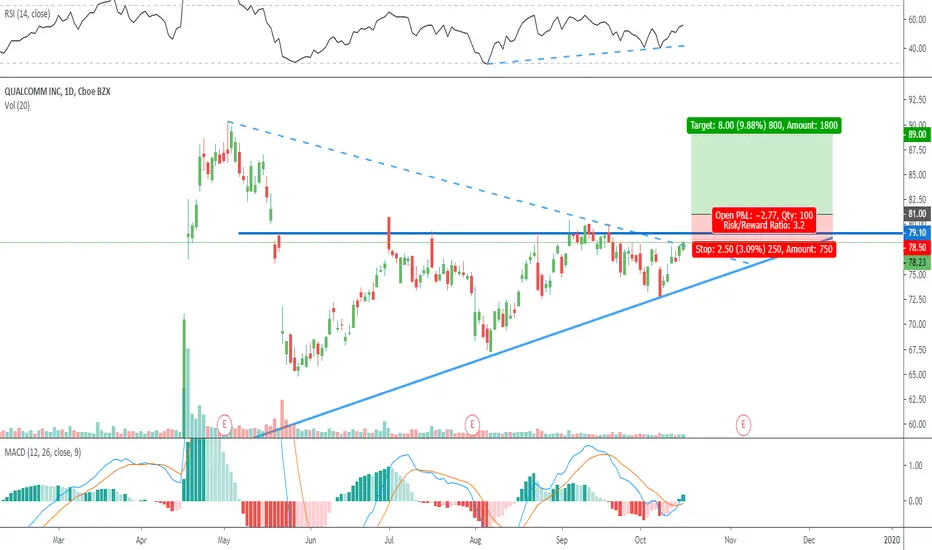
$QCOM Trend-break imminent in Qualcomm. Bullish.Entry level $81 = Target price $89 = Stop loss $78.50
Indicators bullish.
Stock in congestion reaching the apex.
Sentiment has turned on China truce.
Average analysts price target $83.26 | Overweight
P/E ratio 27 (quite high)
Company profile
QUALCOMM, Inc. engages in the development, design, and provision of digital telecommunications products and services. It operates through the following segments: Qualcomm CDMA Technologies (QCT), Qualcomm Technology Licensing (QTL), and Qualcomm Strategic Initiatives (QSI). The QCT segment develops and supplies integrated circuits and system software based on technologies for the use in voice and data communications, networking, application processing, multimedia, and global positioning system products. The QTL segment grants licenses and provides rights to use portions of the firm's intellectual property portfolio. The QSI segment focuses on opening new or expanding opportunities for its technologies and supporting the design and introduction of new products and services for voice and data communications. The company was founded by Franklin P. Antonio, Adelia A. Coffman, Andrew Cohen, Klein Gilhousen, Irwin Mark Jacobs, Andrew J. Viterbi, and Harvey P. White in July 1985 and is headquartered in San Diego, CA.

QCOM - DAY TRADE Hi, today we are going to talk about QCOM and in a Day Trade opportunity.
We observe a 15m chart, some important points such as supports and resistances (and levels of strength) to the Day Trade. The details are highlighted above.
Thank you for reading and leave your comments if you like.
Join the Traders Heaven today, for more exclusive contents!
Link bellow!
Disclaimer: All content of Golden Dragon has only educational and informational purposes, and never should use it as financial advice

Qualcomm Harmonic trade ideasThere are a couple potential harmonics playing out on Qualcomm. The green pattern pictured is a bullish Cypher, with an entry just below $70. If one were to play this conservatively, taking a stop loss at the lower A leg, there will still be a 3.29 reward/risk ratio if a stop is placed below X.
If the price rises to above $84, we'll be in the pattern completion zone for a bearish Gartley, which presents a potentially profitable shorting opportunity. The reward/risk ratio of a short at this level would be 2.99, if played conservatively by taking profit at the higher C leg.


QCOM broke rising triangle supportQCOM has to move downward after break the pattern support, potential short term downtrend. The risk is retracement to the support before falling further
Entry: Red colored

QCOM wedge and things-Possible divergence on Accumulation/Distribution
-Potential wedge on the daily. Expect possible up day tomorrow barring any trade news, then fall out next week.
I currently hold a long position. Do not take this as advice. This is for fun and to watch my skills or lack thereof. lol

QCOM Short PlayHello,
This is a short I would like to share with all. This setup has many similarities to a short play on DISNEY.
+ There is still uncertainty regarding tariffs, and I don't think the leaders will resolve the issue within the time frame of this trade to interrupt it.
Rising wedges are my favorite :)


$QCOM looking good for a break.(QCOM)Looking like a good LONG with a possible breakout pattern coming alone.


$QCOMTwo plays here:
1) Wait for breakout and retest of 72 level (200 MA) and aim for top of triangle
2) Short the Golden ratio / top of triangle. Trim at every dollar.

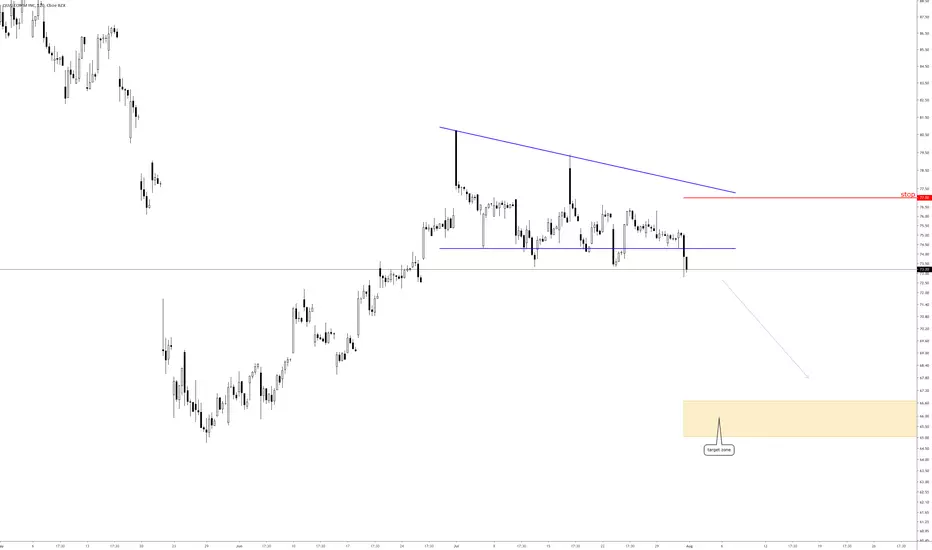
Short trade QCOMNice set up for a swing trade on NASDAQ:QCOM . Could also be a great day trade with different entry, stop loss and target.
Price breaking down under 100 SMA, and 13 EMA crossing down 50 EMA.
Nice gap and go, could head lower today and over the next few days.
ENTRY @69.76
STOP LOSS @72.46
TARGET @65.95

Qualcomm Inc (QCOM) short.All description on the chart.
Please, don't forget to like and follow.
Thank you.