Bitcoin mining- Down 95% from ATH
- At support
- Mac d turning dark red (thats when things move up again)
- RSI at the bottom
Bitcoin at the bottom area.
I am DCA in mining stocks here.
Take care
RIOTD trade ideas

$RIOT ~ As expected...As shown in previous update, correction continues and expect lower prices as shown. Possible opportunity soon but not yet. Will be interesting soon and will continue to track closely.

$RIOT ~ Correction still in progress...As expected, the bitcoin miners are correcting along with bitcoin itself. Although we are getting close to the 61.8 for a normal wave 2, I would recommend being careful as crypto tends to correct a little deeper and should be no surprise to see the 78.6. Remain patient and it will pay off later down the road.

Bottoms in...+Buy and Delete app until 2025. 15-20x gains. My prediction is Riot will control 7-9% of the BTC mining blockchain. BTC will be 100k+ within 3 years. Not financial advice. Long holder.

Something very strange going on.toxic financing? something is off...
this is the type of relative strength that is so bad its just shocking

Riot Blockchain: Weekly RSI illustrating attractive Risk-Reward?Riot Blockchain has been punished harshly over the last few months.
Its common knowledge that Riot is closely correlated to both Tech Equities and Bitcoin. It is also effected by Crypto mining sentiment and macro factors.
With this in mind I believe that this stock is greatly undervalued. I believed it was undervalued at $11-12 but macro-economic factors have distorted this: Central Bank Raising rates; Ukraine-Russian War related Supply Chain Problems; Inflation caused by Supply chain disruptions: War profiteering from Oil companies keeping supply lower than needed.
Between the ranges of $3.60-$4.80 is the ideal accumulation zone. Many holders have a cost base higher, including myself.
Due to rapid growth in the companies mining capacity, which is accelerating into the start of 2023. The company is significantly undervalued from a fundamentals stand point.
The Daily RSI attractiveness is in a similar setup, to the multiple sub 30 RSI tests in 2018. A time period that was also a Bear Market.
1) Be greedy when others are fearful.
2) If you believe in a Companies business and promising future outlook. Don't let a bear market discount be the reason NOT the DCA. Even as the stock has been trashed recently, the fundamentals have not changed.
3) The fundamentals are the strongest in the mining business. With huge mining capacity coming online over 2022 & 2023.
>>> Eyes on the Medium to Long Term<<<
Just one swing traders opinion, not financial advice.

Riot Blockchain solidified support for a move to the Upside.Riot Blockchain has been overlooked over the last few months. As Clearly seen on the chart, the correlation to Bitcoin's movements is closely correlated.
> I Believe that an ascending support line has been tested multiple times but both Riot Blockchain and Bitcoin.
> With the momentum driven by earnings season in the stock market providing significant upside potential for all equities, especially in the Tech Space.
> Combined with Bitcoin's Recent strong upwards momentum from yet another confirmation of strong support.
> We are likely to see a rapid rise in the price of Riot over the next few weeks. I think this is an ideal range to DCA at the lowest risk level we have seen Riot Blockchain range in for a significant time.
1) Be greedy when others are fearful.
2) If you believe in a Companies business and promising future outlook. Don't let a discount be the reason NOT the DCA in lower to a stock you believe will be significantly higher in the long term.
3) The fundamentals are one, if not the strongest in the mining business. With huge mining capacity coming online over the next few months.
>>> Eyes on the Medium to Long Term Chap <<<
Just one Long term focused Investor/Traders Opinion, not financial advice.

$riot bottoming here?$riot looks good on multiple timeframes.
$riot has doubled it's $btc production rate since last year and with the next $btc halvening in just 2 years, this looks bullish for $riot

RIOTLONG-TERM: While Bitcoin is testing a breakout on the daily at its critical multi-year support zone, RIOT has broken out of a downsloping channel and formed a smaller wedge at a major support historically, with classic bullish divergence on the RSI. Using a tight stop on this one so it could fail easily on one red day, but if it does work, it's a great reward to risk ratio. (not financial advice)

Long RIOT at $6.24www.tradingview.com
At what appears to be a new 4 hour support level, and after a 9% selloff, going long RIOT at 6.24 per share.


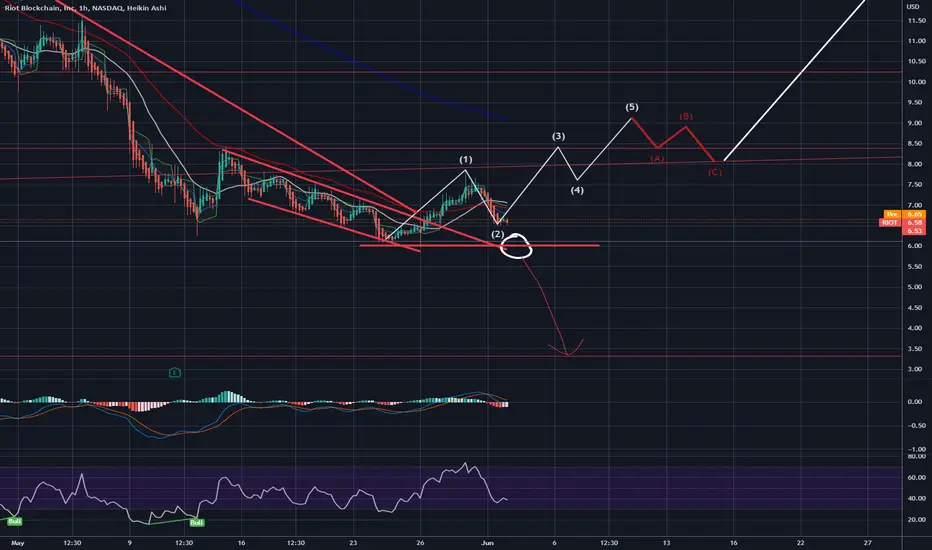
RIOT bullish reversal setupWe may have some summer relief rally in the markets
RIOT is out of the downtrend channel.
Looks like 6 is a solid bottom and we should see gains from here (assuming BTC doesn't fail completely)
Based on Elliot waves; My short term target is 8.36, long term target is 12.
Riot may need to test that 6 again and if it does brake below, it may land it at 3.50.
RIOT - ShortRiot Blockchain, Inc. is a Bitcoin mining company, supporting the Bitcoin blockchain through rapidly expanding large-scale mining in the United States. We are focused on expanding our operations by increasing our Bitcoin mining hash rate and infrastructure capacity. Riot believes the future of Bitcoin mining will benefit from American operations and endeavors to be the driver of that future.
Given the current circumstance of Crypto uncertainty, RIOT may continue lower.

RIOT If and ONLY IF This Name Can Drop UNDER $1.00 It's A BUY!Title says it all this name can go to where NO ONE thinks it can go to 0.88c if it does we will back up the truck long on this one. Not advice do your own DD We are NOT SHORT this name.

RIOT Time For A Bounce Title says it all who knows how low this can go but its due for at least a short term bounce for you day traders out there not advice

beautiful monthyl RSI running into support for RIOT.Bottom is close to in. RSI at low 40's on monthly. Ready for a big final wave 5, 2023 - 2024 for the next btc move... these move x 10' multiples relative to BTC.
building a position here over this year

Good time to buyNasdaq will likely bottom this week. Unfortunately, this correlates strongly so we will see a bottom in the $7 range. Very irrational market at the moment and a great time to buy some at these lows. My TA shows there will be double bottom by the end of July and markets will be much higher by q4 of 2022.
Remember hold, don't trade, by end of 2024 we can be 3-12x this price. Riot is expanding and could have up to 50-100 exhash by the completion and running of their next building.
Disclaimer: I have over 2000 shares, avg at $12.

RIOT block chain. If reversal... near accumulation ZoneHi all
I think we are in the accumulation zone. Do not see the price going that much farther below than 9$
Reason being is people who bought before it launched up are likely still holding.
It launched due to hype of bitcoin and algos identifying it, hence its been in a long down trend as the institutions have sold back their short-bought shares.
I think we will be in an accumulation zone noe similar to HUT. There may likely be more downside between 8.5$ and price around here. I will start averaging in once the market settles and am seeing reversal patterns.
I will keep my eyes on bitcoin and see how it does then modify my strategy accordingly.
Keep an eye on SPX and the NASDAQ. Overall the market is bearish right now.
Cheers. Open to discussion

$RIOT next supports in the single digitsOn Friday, Riot broke a key support at $14 and is not trying to find support.
The next support levels are all in the single digits. I do think the support at $9 will likely break and that we'll end up somewhere between $3-6. Let's see what happens in the coming weeks.

RIOT - WATCH THIS SUPPORT TREND LINE AND CHANNEL FOR NEXT MOVES As a BTC mining stock, RIOT SP and BTCx are correlated, so the sharp fall in BTCx prices made RIOT lose 13% last Friday.
RIOT is currently moving along a rising channel (defined in green colour in my chart). The current trend line (in bold green) is acting as the main support for this stock. RIOT SP should fall to this line and bounce back up quickly if BTCx shows its recovery on Monday / Tuesday. If BTCx lose its strength and keeps going to fall in the next weeks, the current trend line can not hold RIOT. As a result, it will fell off its base and start a downtrend in an immediate term. The next support levels below (in blue on the charts)
So investors should keep a close look at the reaction of RIOT when it touches the current trend line for the next moves.
My idea can be 100% wrong, do your own DDs before entering to any trades.

Short $RIOT CMP $17.21Short $RIOT CMP $17.21. Bear flag. MACD turned bearish. 9 SMA rejection. This one tried to break above 50 SMA but failed.
Short Target 1 is $13 area

RIOT bullish falling wedge!As many of my followers know, I am typically not one to talk about stocks (as my username indicates, I largely talk about cryptocurrencies). However, I do typically make exceptions when the stocks deal with crypto and/or blockchain.
In this example, I want to call out the falling wedge that has occurred with RIOT blockchain. Since the all-time high (ATH) at the beginning of 2021, the price has falling over 85% to the bottom of what looks to be a falling wedge that is forming, which is often a bullish sign. This bullish trend looks further confirmed by MACD forming a nice "reversal" divergence (dotted white lines on price and MACD) indicating that a reversal very well might be in order soon.
There is still some downward potential however, and the general market for both stocks and BTC could easily drag the price of RIOT further down, however, the trend for now looks like a reversal is at least possible for RIOT.
But as always, this is just my opinion and in no way should be taken as financial advice. However, please like or comment if you agree or see anything in addition.

RIOT ShortRIOT is heading to 10 levels, brace yourself, you may be see and uptck for a possible short entry
