Riot Moving up towards bigger pattern resiatnce. Higher high higher lows. Does it need further correction or can it hold here. Watching all of my support levels 51.25 is an area I’m watching but the pattern I perceive it’s in is holding support as of now. Slowly creating. Bullish divergents but not confirmed
RIOTD trade ideas

RIOT Rounding UpRIOT has formed a rounding pattern, the top of the rounding formation will meet resistance at the $65 level. It has also posted a higher low and is showing signs of a correction wave pattern, which could take price to $73 range as a secondary target. Best case scenario is to take profits at $65 and look for a re-entry after a pullback off of the 65 resistance, then ride the next wave higher to 73. A break below the rounding pattern would trigger an exit, which currently would be the 52-53 range as a stop.

$RIOT - needs to hold $51.61If RIOT can hold $51.60 ish level, we may revisit $80 in next few weeks.
Patience is a virtue. The trend is your friend.
Super volatile stock.


RIOT: Bullish flag (63%), Bullish pennant (130%)Primary Target (short term):
Bullish flag, confirmed (63%)
PT = 110.90$
Secondary Target (Long term):
Bullish pennant (130%)
PT = 125.40$

Moar dump?Called the top on $IDEX at ~5$ no one believed me
Called the top on $TSLA at ~900$ no one believed me
Not saying this is the top on $RIOT but this doesn't look good to me. Pretty obvious A&E IMO. I wouldn't be surprised to see a bounce and more upside off the neckline either though so I'm not going to short but all the perma bullish charts and NO mention of A&E is quite alarming.

Riot Blockchain forecastThis projection is based on a conglomeration of input data like log scale trend, elliott wave, overall market cap potential of the underlying, a 47 day consolidation period, and very bullish sentiment within BTC, Riot could easily 10x its comparative 2017 pump just as BTC has demonstrated 10x cycles, riot is still a very small market cap and riot has some catching up to do considering other blockchain related stocks have begun their moves

RIOT 'Short' TermJust found these three crows on the 1Hr Chart. I don't imagine this being a continued downtrend but a quick swing trade. RIOT moves very fast, so I will be watching this one closely.
Sharing an idea for the first time - all suggestions/improvements are welcome.

RiotClearer veiw of what I’m seeing as far as support and resiatnce above and below. Look left also to see how it all coincides biggest fear was this all is a huge head and shoulders pattern but we won’t know that until support is broke.
RiotSmall pull back here upon first rejection of 56.30 area. Didn’t expect to get it on the first try. Back testing old resiatnce as new support. Can it flip to support? Time will tell


RiotSo even with this extreme bullish sentiment that riot is in I want to put out there thst 54$ is either massive support or an area of
Support that has been hard for riot to hold. I want to see this hold as support which so far it is doing and we got a great bounce from. We are hitting strong resistance above so I wouldn’t doubt if we bounce between 56.30 and 54$ for a little while until bitcoin breaks 60k. 55.11 is the 200 ema on the hourly but we may go sideways annflag out to reset some oscillators. It’s possible for us to run of course with earnings but the biggest gains I’m expecting is next week if Btc breaks out next week
55.78 was my first target which was hit. 56.30 is upper trend line and above that is 62.05 as upper resiatnce which will be difficult to get through


Bullish Continuation > $BTC $RIOTEarnings on the horizon, there's a lack of confidence here..
Don't forget the meteoric rise during Q4 of 2020 (165% Gain Alone).
We can see we are still in an uptrend.
We can see rejection off 20 Day EMA.
We can see neutral RSI, and potentially bullish Stochastic RSI.
Bitcoin is also doing well this week, and will have a strong April, as we are entering a new quarter and the end of quarter rebalancing for funds will ease.
The only risk on the charts is a potential Inverted Adam & Eve formation (double top), although, I'm not certain it's valid given the 22% difference from the initial peak.


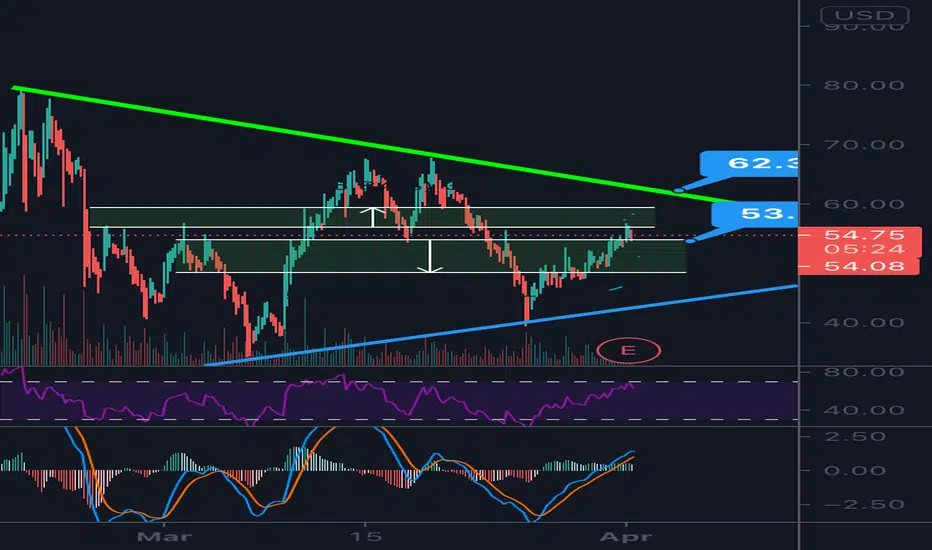
RiotJust starting to break longer term resiatnce e here. Still have to face 62$ resistance but 54$ level is a huge resistance if it can flip to support. Have been long since 4650 and added at 49.86 like we discussed with calls as well this morning I placed more. Let’s goooo

RIOT running again! - Chasing Bitcoin to All Time HIGHSOptions and shares will pay well in RIOT this week. We had some lag in the price yesterday while investors watched Bitcoin anxiously. With the bull run in Bitcoin confirmed, Riot is undervalued, and gaining slowly, but that's just for now. Don't miss out on this one, because it's going to print that money. Cheers all, and I hope you're all eating well.

RiotPlayed the breakout of the falling wedge at 46.50. Keeping stoploss at break even. May add to position if we can flag out or close a 4hr with volume above 49.87. So far breakout of this pennant but has faked out a lot. Keeping a close eye on this guy. Main larger target pattern resiatnce is 63$ resistance with overall target of 107$ but really depends what BTc doesn’t here i am holding over 40 shares of RIpT so let’s see where it goes

Bitcoin to reach Alltime High - RIOT set for a bull runUpside price target in the 80's for this week! We're at the beginning of an awesome bullrun to catch up with Bitcoin in the 70K range


Long | RIOTNASDAQ:RIOT
Possible Scenario: LONG
Evidence: Price Action
This is my idea and could be wrong 100%,
TP1 ~64, 68, 75
CALLS for 26 March Strike 78$
