ROKUIF QQQ can comply and move forward higher ROKU can explode
Even with weakness though i believe the main leaders in tech currently would be ROKU / NFLX ..
NFLX does have upcoming ER so this could be reason as to why it's strong going into the new month while QQQ has been shaky and moving towards the downside. Expect ROKU and NFLX to continue with great strength and surprise.
IF Roku gets above 340 this opens the door to 370-420 range.
Monthly iTM calls could pay NICELY if we catch some steam on this one
LIS 316
ROKU trade ideas

$ROKU Looking TastyHolding good support at Demand zone with a nice green candle today. Run up to earnings and historically they beat.
I think this runs to first target AVWAP and volume shelf $360 zone. Watching for a close confirmation above 21 EMA before entering.
For an option trade with less risk, an idea would be to sell the .34 Delta 12/17 300P and buy the 295P (or 300/295P spread) for credit of $1.95 , max loss $305 .

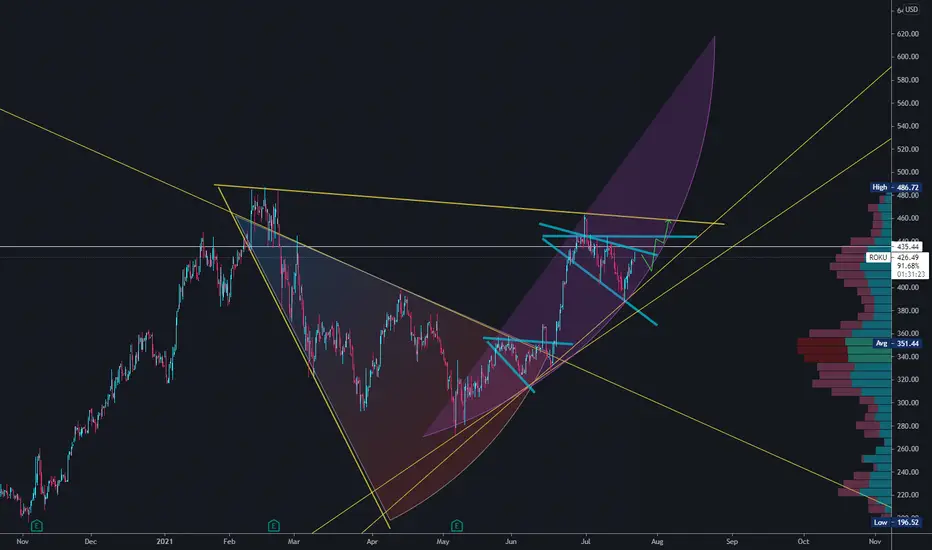
ROKU - FOLLOW THE PARABOLIC ARCAll,
Pretty bullish on ROKU here. Only question right now is that if SPY holds since it had a tear back up from 420s. However, this looks like its ready to go might retrace some here so mayh want to wait for a better entry. Just watch closely. I think as long as market doesn't cause a crash in big stocks like ROKU we see 440s and probably 480s. IF THIS BREAKS THE PARABLOIC ARC... the right side it will fall and I would take a PUT or short position

$ROKU Plan for this week solid orange are intraday actionable plays
dotted are take profit targets
Harmonic pts are for longer dated positions


strategy for ROKU MONDAY 10/04/2021(ROKU buy price 316.00)
(ROKU sell price 306.00)
strategy: entry above the buy price. Possible gap retest, this we must take entry in the zone of the mv 9 or 10 period in graph of 5mn. It also has a double inside bar.
bearish entry: has divergence between the chart 5mn bullish 15mn bearish. If the opening is bearish, we only enter lower when the stock has penetrated the buy, sell price and double bottom zone. wait for confirmation.

Khan's Chart-Requests 18 - $ROKUChannel-Bottom with solid Support - don't get greedy but with enough Volume i see a nice push

ROKU great R:RROKU
Working on a breakout right now
$340 will be a very strong resistance but also a break could send it to $350 quickly

ROKU - TRADE SETUPI like this break of support there. There is nothing stopping this from going to the next level of support which the is monthly 20EMA.

$ROKU Downtrend Breakout Retest$ROKU Broke out of a two-month downtrend last week and appears to be holding the downtrend line as support today. High probability of a bounce from here. Average analyst price target on this stock right now is $475, I don't see it going lower from this $310-$320 support area.
Near term target: $370 by mid-October
$480 possible by early November depending on overall market conditions. Stop loss just below $310.
I am long Oct 15th $350 calls for $3.00
Note: This is NOT investment advice. Educational only.

ROKU - Channel, EW Count, and TriangleNeeds to trade back up into this Ascending triangle soon or it will become invalid. A break below the middle channel line most likely completes the double top around .62 fib level. Overall we see ROKU as a safe investment long term and I like having some exposure here at these levels initiating a 1/5 position.

$ROKUShares of Roku dropped as much as 4.8% lower on Friday, hamstrung by a bearish note from Wells Fargo analyst Steven Cahall.
The pessimistic call on the media-streaming technology stock counterbalanced an upgrade that drove Roku shares higher yesterday.
Cahall downgraded Roku from overweight to equal weight, meaning that the analyst now believes that Roku shares don't provide an exceptional investment opportunity anymore. He also lowered the price target on the stock from $450 to $388 per share. That's still 16% above Roku's closing price on Thursday, but the Wells Fargo analyst sees better ideas elsewhere because this stock looks "fully valued" at current prices.
In my personal opinions I’m fairly flat on Roku.
I’m not bullish but I’m also not bearish.
On the technicals you can see price has broken out of its falling wedge on the daily and looks tempted to run.
With the MACD curling
& the RSI recently coming out of oversold territory.
I suggest keeping this on your watchlist.
- Factor Four

Initiated longs here Per our previous post below, i think the correction is over and i have initiated a small long position.

ROKU LONG SWING TRADE | ROKU | LONG @ 336 - 340 | TP @ 344, 348, 352, 356, 360 | SL @ 320 | PATTERN = DOUBLE TOP BREAKOUT |
PNF chart on the hourly shows a breakout, DOUBLE TOP BREAKOUT
The strategies I use involve a mix of PNF and Renko. My type of trading is strictly swing trading.

ROKU ROKU ROKUROKU closed out of it's trend line yesterday after dipping into the buy box for the past 3 days, consolidating. Oversold on the daily!
Could be a solid swing play 340-355, target high at 366.51.

$ROKU - At critical level, with inverse H&S, calls above 330$ROKU - At critical level, with inverse H&S, calls above 330

$ROKU . falling wedge . FIB 0.618ROKU still below the AVWAP from the beginning of this cycle
the FIB 0.618 if holds --> we are pushing through..
combined with falling wedge breakout .

Bearish Signal in ROKUAfter touching its all time high, ROKU came down on profit booking and breached its support level of 360-75. ROKU has triggered Bearish crossover, Fast momentum is finally down now and steam for downward trend has been building slowly in this stock. Sell on Rise setup has been formed in this. If ROKU rises to 360-75, then it would be a very good candidate for Short selling or exiting if you are still holding long positions.
Short Sell between 360-75 with SL 375 or Short sell below 305 with SL 323.
Disclaimer :
Trading is never ever recommended as it is injurious to mankind. This is purely my study based on technical charts and for educational purpose only. Please do your analysis before taking any trades given by me. I MUST not be held responsible for any profit or loss out of any trades you take on our advice. All Disclaimers Apply.


$ROKU | WEEKLY WATCHLIST 9/20My top watch this week. Way too much confluence at these levels for me to ignore the setup. Looking like we are bottoming out to complete the large wave 4 at the 50% retracement. Also, a very tight falling wedge looking like it's on the verge of breakout. Please refer to the chart for more info.
Goodluck!
$ROKU - Inverse H&S, 330calls > 326 target 339 stop loss 319$ROKU - Inverse H&S, 330calls > 326 target 339 stop loss 319

ROKU Reversal!!You don't need to be a candlestick expert to know how to trade them. It doesn't matter if you know the difference between a doji and a spinning or a star and abandoned baby.
They all have one thing in common, the next candle needs to open clear above/below the prior. Over precision is not a traders friend.
ROKU +50% in ~45 days from this exact price twice before. Will it be three times before the end of the year??
