ROKU Double Bottom On the Daily!You can see it clear as day after the beautiful C&H and pop last month! Another pop will be coming!
Lets goo!
ROKU trade ideas

ROKUOn 2/22-2-23 ROKU sold off from 483 to 381, and was able to bounce 30 points.
11/9, ROKU gapped down 8.6% and was able to bounce 4% at open that day.
5/7/20 ROKU gapped down 8.9% next day after earnings and was able to bounce 6% that day.
ROKU is at 384 (-8.6%) AH. If roku can hold above 380, it's possible to see buyers step in at open today.
If ROKU can't hold 380, it can sell off to 362.
Trade Idea: 8/6 400C (higher risk trade/quicker trade)

Roku 4hrEarnings sent it back down to the neckline, if it holds here, good RR to go long + gap to fill.

ROKU double TOP | Less Streaming Viewing55.1 million active customer accounts for the quarter and 17.4 billion streaming hours.
VS
55.8 million active customer accounts and 19.19 billion streaming hours. (The Bloomberg Consensus estimate)
The chart pattern looks like a double top.


ROKUPretty simple play here. A break and hold of bullflag heading into earnings . With TWTR and SNAP crushing earnings , I look for a much higher move here.

$ROKU - Possibility of reversal at $421 areaROKU is entering the buy zone and has a good probability to reverse the downtrend at around $421-$422.
If the reversal occurs at 421, there is a setup for PMG #Strat


ROKU needs to bounce asap otherwise its headed to 390Roku has been a downtrend for 3 consecutive days, it needs to bounce for a recovery before earnings

ROKU
📈 meanwhile still above the key level short term (yellow zone) have possibilities following up to $600, if not, could drops below $400

ROKU ShortSupply Zone Confirmation
Trendline break
WR crossed -20
8/4/2021 Earning
Short 455
Stop 495
Target 390
Risk management is much more important than a good entry point.
The max Risk of each plan should be less than 1% of an account.
I am not a PRO trader. I trade option to test my trading plan with small cost.
I created some tradingview scripts to improve my trading entries:
Williams %R two lines;

ROKU, Can makes us a millionaire ! We certainly follow !ROKU, Following the trend of the stock can makes us a millionaire! You doubt? Follow the analysis.
Roku is certainly one of the best stocks in the market. General trend of the stock is still up. We have the prediction of ROKU in weekly and daily time frames on the left and right side of the chart respectively.
Weekly chart:
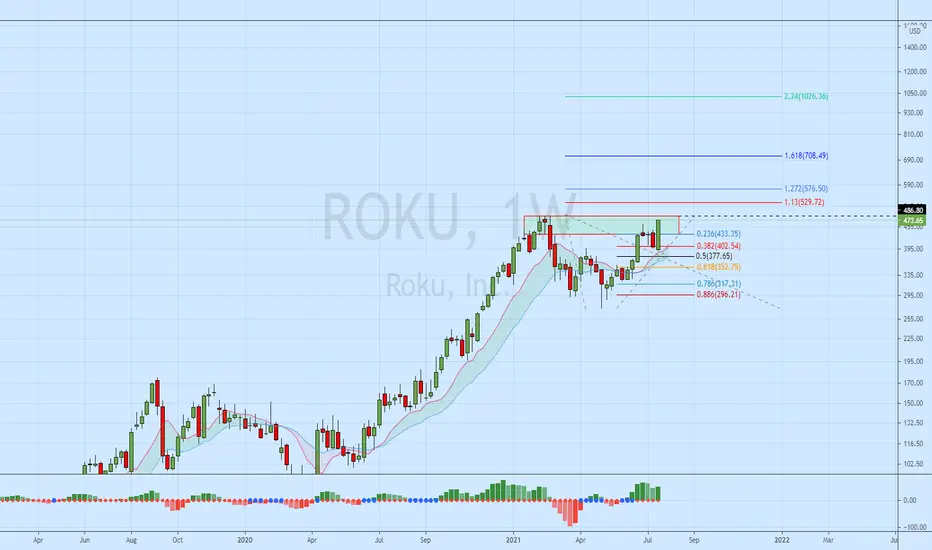
We never know whats going on the market or a stock without looking at monthly or weekly time frames. Looking at weekly chart of ROKU reveals that the stock is currently completing it's wave 5 of (3) which may ends at 500, 523 or even 555 USD. After that, a considerable decline (Wave (4)) is expected down to 272, 214 or even 131 corresponding to 50% , 61.8 % or 78.6 % Fibo Retracements respectively.
Is decline going to continue further? Of course not. Another and final up going wave (5) will start at proposed support prices which makes a new All Time High (ATH) up to around 600 USD ! Here the Big Short is to come ! :
Great Short Opportunity my friends : Completion of mentioned wave (5) will complete a large cycle Elliott wave which has around 4 years duration. The correction which will start at least takes 18 months and push down the price to 272 , 214 or even 131 USD ! corresponding to 0.5 , 0.618 and 0.786 Retracements respectively.
Daily chart :
We have a closer look at ROKU in daily time frame. As mentioned above, Stock is currently making it's wave 5 of (3). Wave 5 has it's own subdivisions. There are still two up going ( which we are currently in the first) waves and one correction in between to complete the whole wave 5. The up going wave which we are currently in will terminate around 480. A correction down to 400-423 is expected and final up going wave up to 500, 523 and 555 will trigger the correction of above mentioned wave (4).
Are we going to become a millionaire ? Why not? It is absolutely possible.

ROKU on watchROKU looking strong going into earnings. Good chance for a breakout here. Want it to stay in and above the green box. Targets = fib extensions above.
$ROKU - Will we see a pullback on ROKUIs there a pullback coming on $ROKU..we will see. If W5 doesn't extend beyond 485 to higher highs we may see a pullback on ROKU to complete abc.


Gann Grid on rukoFor The minor swing trader and day traders .
Gann Grid built on a Major Gann box ( hidden ) based on the current impulsive wave .

ROKU (BULLISH)Looking to buy the dip on ROKU rather than chase up here at these levels approaching previous ATH region. Still bullish none-the-less in the bigger picture.

$ROKU : massive breakout massive bullish run
retracement back to 0.618
resumes bullish run again.. taking out targets
PT 564


Bull Flag Throwback Earnings 8-4 AMCSpinning top, a candle of indecision today so far.
Earnings 8-4. I do not see a miss since 2017. Beating earnings does not always mean price goes up, as well all know. The reaction to the news is often more important than the news itself.
Bull flags consist of a quick run up which forms the pole and goes with the overall trend, and a small channel down that goes against the overall trend.
Bull Flags can break either way and throwbacks are common. Flags are consolidation and often continuation patterns.
A flag should not go on and on and should be no longer than 3 weeks in formation. You may see decreased volume during formation but increased volume with a breakout.
Throwbacks hurt performance. An uptrend is needed to confirm the break out.
No recommendation

roku trend line break out roku is been on some monster runs i think we got some trend line action small break out and then back to the yearly low

ROKU a strategy for what they want to be without stressROKU a strategy for what they want to be without stress. simple now let's see the following in roku. Continuation bullish price with different strike price if you trade with options, buy the 475.00 and sell the 472.50 or 470 it can be at the market if your broker allows you to buy with the market closed since at the limit the brokers tend to manipulate the entries if the market opens higher this they buy the bearish price and vice versa.
The explanation is the following with this two price in price 475 the stock gives the bullish continuation and with the 472.50 or 470.00 the downtrend begins. if it opens up with gap retest and if down with gap bearish gap and go

ROKU Pivot Breakout Buying on the breakout or close of the day wit the stop below the low of the day. Breakout had well above average volume with volume declining during the prior consolidation.
Entry: $463
Stop: $426.86 (-7.81%)
