THE WEEK AHEAD: ROKU, WYNN, SQ EARNINGS; XOP, USO, GDXJ, EWZEARNINGS ANNOUNCEMENT VOLATILITY CONTRACTION PLAYS:
... Screened for options liquidity and 30-day implied greater than 50% and ranked by "bang for your buck":
ROKU (38/31/16.4%),* announcing Thursday after market close.
WYNN (27/76/14.7%), announcing Wednesday (no time specified).
SQ (43/74/14.3%), announcing Thursday after market close.
PYPL (56/60/11.6%), announcing Monday after market close.
GM (20/59/11.4%), announcing Thursday after market close.
QCOM (45/54/10.9%), announcing Wednesday after market close.
BABA (65/55/10.5%), announcing Thursday after market close.
Pictured here are two 2 x expected move setups in ROKU, one in November (19 days 'til expiry), and one in December (47 days 'til expiry).
The November setup was paying 8.55 at the mid price as of Friday close, with delta/theta of -.89/51.22; the December: 10.13 at the mid price as of Friday close, with delta/theta of -.95/27.88. I could see doing either, with the primary benefit of the shorter duration being that the volatility contraction tends to be more rapid, and with the primary benefit of the longer duration one being that you've got a little bit more room to be wrong.
If you're of a more defined risk bent, look for an iron condor setup paying at least one-third the width of the wings in credit, such as the November 20th 160/165/265/270, paying 1.63.
Look to put this on in Thursday's session prior to market close, adjusting strikes as necessary to accommodate movement between now and then.
With the exception of GM, the remainder of the underlyings can be short strangled or iron condored, but would go short straddle or iron fly in GM due it's size (34.53 as of Friday close).
EXCHANGE-TRADED FUNDS RANKED BY PERCENTAGE OF STOCK PRICE THE DECEMBER AT-THE-MONEY SHORT STRADDLE IS PAYING AND SCREENED FOR THOSE PAYING >10%:
XOP (23/69/18.7%)
USO (14/71/17.5%)
GDXJ (22/56/15.7%)
EWZ (29/56/15.5%)
XLE (38/57/14.9%)
GDX (23/46/13.3%)
SLV (28/48/13.0%)
XBI (36/44/12.1%)
EWW (35/49/11.6%)
IWM (42/42/10.8%)
SMH (28/42/10.9%)
QQQ (43/40/10.8%)
BROAD MARKET:
IWM (42/42/10.8%)
QQQ (43/40/10.8%)
SPY (38/38/9.6%)
EFA (33/30/8.4%)
IRA DIVIDEND-EARNERS RANKED BY PERCENTAGE OF STOCK PRICE THE DECEMBER AT-THE-MONEY SHORT STRADDLE IS PAYING AND SCREENED FOR THOSE PAYING >10%:
EWZ (29/56/15.5%)
XLE (38/57/14.9%)
KRE (32/50/14.1%)
SLV (38/48/13.0%)**
XBI (37/44/12.1%)
* -- The first metric is the implied volatility rank or percentile (where 30-day implied is relative to where it's been over the past 52 weeks); the second, 30-day implied volatility; and the third, the percentage of stock price the November at-the-money short straddle is paying.
** -- SLV does not pay a dividend.
ROKU trade ideas

Bullish falling wedge, declining volumeROKU has been consolidating and cooling off recently filling most of the gap down left from a few days prior. The falling wedge pattern paired with declining volume is a bullish signal that a move is to come. Fib levels up to ATH above.
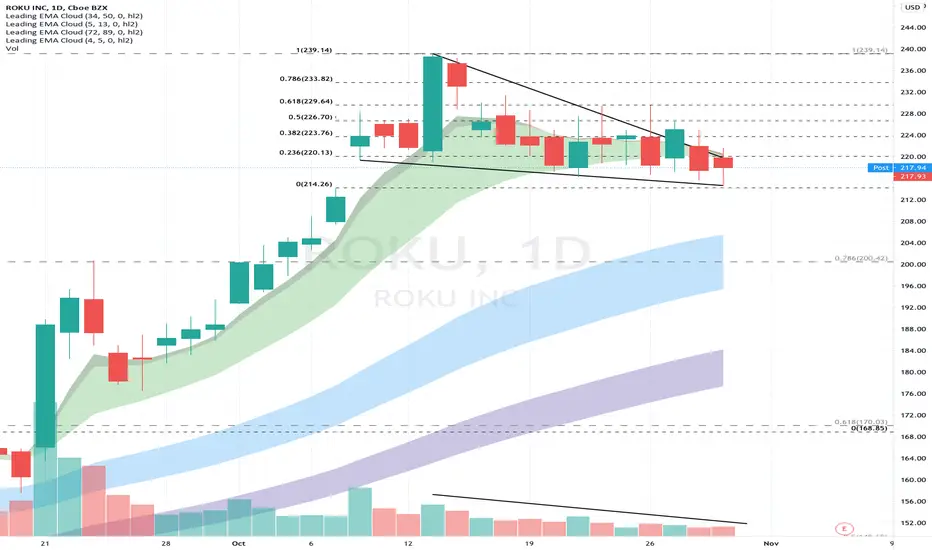

$ROKUHolding 217 so far and earnings coming up next week (nov 5th). If earnings are positive and investors like it, this can go 228, 232, 240. If not it can dump to 50 MA.


Roku - Just making charts cleanerWe are in the 5th wave of the larger 3.
We are going to 270 to finish the large 3, then back to 220 for 4, then back up higher.
Short-term upside
Long-term upside
A perfect trade opportunity to sell and re-enter lower in the medium term.
BUY below 225, sell at 270ish (could extend higher), then get back in lower.

I like ROKU for a short... still.Breaking 218 and it's a landslide, atleast 200 pt, green box is buy zone.

$ROKU looking prime for a long entry @$215.20.I like $ROKU here - so long as the market volatility stays mild and #ROKU can hold the blue ascending trendline line, going long around $215.20 has great risk/reward.


ROKU - The Stock Market in 3D - repeating slopesA recent Roku Diamond provide ample back-tests to identify repeating slopes in the pattern


ROKU 9 DAY FALLING WEDGERoku forms a falling wedge pattern over the course of 9 day. Wedge started begining peak at 238.66, falls to 221.70. BUY SIGNAL


Roku Update - One More Higher High?I looked back at my original Roku charts on my profile and hit the "play button" so you can see the before and after of your projection. My original projections were pretty spot on. Click the chart that says "Roku is going higher."
I see Roku going higher after retracing to about 210 (as shown on the chart) before a final 5 minor waves up to finish 5 of 5 of 3. If this projections starts to play out I will update the chart with an extension to where I think it can go.

BUY CLOSED ON ROKU! +9% ACC GAIN! 🤪Great BUY here achieving a total account gain of 9%! from risking just 1% per trade! SELL NOW OPEN! LETS SEE WHAT WE CAN BANK!
HOLD YOUR WINNERS! STICK TO YOUR PLAN!
What is our strategy?
Our strategy is a trend following strategy - that is coded in pine script to use with the trading view platform - the entries are shown automatically! NOTHING is done manually, it can be used on any instrument and time frame. However, we have hard coded specific parameters for when trading the H1 time frame, so we can back up over 4200 previous trades to confirm our edge from previous data. This gives us confidence in execution and belief in our trading strategy for the long term.
The strategy simply sits in your trading view, so you will see exactly what we see - the trade, entry price, SL and multiple TPs (although we hold until opposite trade as this is the most profitable longer term plan), lot size, etc.
This could be on your phone trading view app, or laptop of course.
The hard work is done, so we have zero chart work time, no analysis, no time front of the chart doing technical analysis - technical analysis is very subjective - you may see different things at different times - how do you have a rigid trading plan on a H&S shoulder pattern? Your daily routine, diet, sleep, exercise can affect what you 'see' and your decision making, this doesn't happen when a strategy is coded like this; what we do have is a mechanical trading strategy...
What does this mean?
It means, we are very clear on our entry and our exit and use strict risk management (this is built in - put in your account size, set your risk in % or fixed amount and it will tell you what lot size to trade!) so we have no ego with our position and we are comfortable with all outcomes - its simply just another trade. This free's our mindset from worry and anxiety as we take confidence from knowing our edge is there and also that we have used sensible risk management.
The strategy itself can be used as a live trading journal too!

ROKU - Up to $221 - $223, then Drop to fill gap $215 - $213StochRSI 1H have a Bullish Divergence + MACD 1H ready to cross up.
Long to $221 - $223, if bull team can not hold that line, ROKU could drop to fill the gap $215 - $213.
Good luck and Disclaimer

ROKU dijanka naik keparas 1.618Jangkaan ROKU untuk naik sedikit lagi sebelum membuat reversal untuk jatuh

ROKUOne more push up before a larger correction. Wave 4 could be a complex correction but looking for one more high targeting 250.

ROKU trend line brokenNASDAQ:ROKU broke the trend line and is now under the SMA 20. Expecting major resistance at at $228 that should force it to go back down to $218 and maybe even gap fill to $212.
SL at $229
None of the content published constitutes a recommendation that any particular security, portfolio of securities, transaction or investment strategy is suitable for any specific person. Information provided in this correspondence is intended solely for informational purposes and is in no way guaranteed.For financial advise seek appropriate investment advice from a licensed Industry representative.

ROKU - SWING ANALYSISROKU - As per the daily candles it is expected to fall further.
Sell here at current price 222
Stop loss around 231
Potential downside target 206
Follow the levels as mentioned in the chart and
Hit the like button and write in the comment section thanks
