$SLB with a bullish outlook following its earnings #StocksThe PEAD projected a bullish outlook for NYSE:SLB after a negative over reaction following its earnings release placing the stock in drift C with an expected accuracy of 66.67%.
SLBD trade ideas

SCHLUMBERGER Monthly Technical AnalysisSLB monthly - EDUCATIONAL only - Support, Resistance, Confluence, Fibonacci, Pitchfork - PRICE in a STRONG RESISTANCE area

SLB is breaking out of a head and shoulders patternIn this chart I point to main chart pattern in the SLB prices at this moment, that is the head and shoulders. Not only that, but the prices are doing a breakout of this pattern, that I indicate step-by-step at the purple text in the chart.
I am also trying to take some advantage of this movement, and so I bought a very short term put option to try catch some profit from an eventual falling in prices. The put information is in the gray text in the chart.

$SLB with a bearish outlook following its earnings #StocksThe PEAD projected a bearish outlook for NYSE:SLB after a negative under reaction following its earnings release placing the stock in drift D with an expected accuracy of 40%.

SLB Shortwe can see cross-two MA for this underlying. This makes my idea to short it if it could not break above the moving averages. Personally, I think SLB can start turn into a downtrend

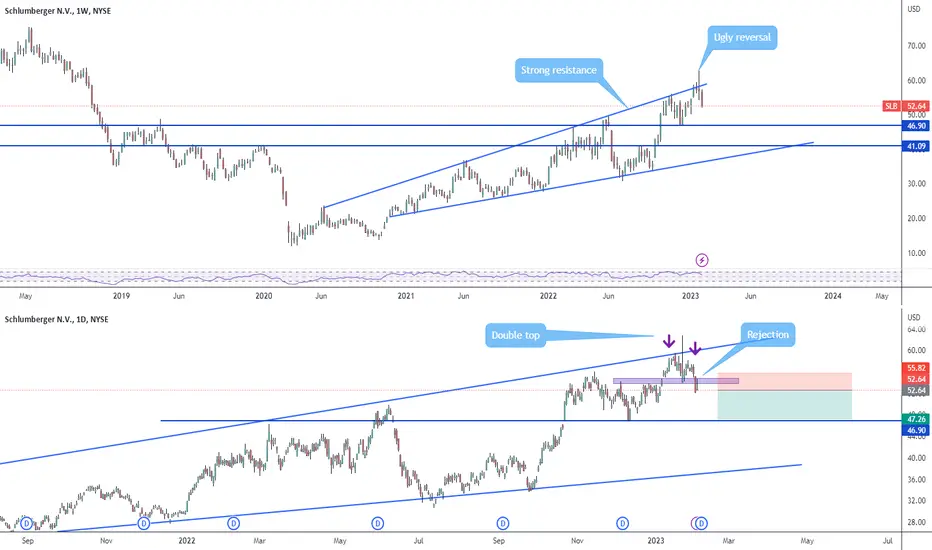
Ugly reversalTop chat in the weekly time, bottom chart in the daily timeframe,. Looks that price is heading to the $47 support level. It may drop to the bottom of the channel but the energy sector still strong. I take profit at 47, then I'll see.
SHORT SLB - (ascending triangle+waveC)Last weeks SLB has significant growth, time to cool down. There is huge year ascending triangle with fake breakthrough, elliot waves show correction phase abc.
Use 50% entry at half of wave 5 = 57.25, add another 50% at 59.

$SLB : outperforming stock in strong sectorSLB consolidating inside an ascending triangle with possible breakout to ATH (all time high) levels above $56
Shrinking Volumes with price in consolidation showing base formation for breakout to higher levels
SLB is an outperforming stock in a strong sector $SPN

$SLB with a Bearish outlook following its earnings #Stocks The PEAD projected a Bearish outlook for $SLB after a Positive over reaction following its earnings release placing the stock in drift B with an expected accuracy of 50%.

SLB D1 –rejection from W1 supply, and from TLSLB D1 –rejection from W1 supply, and from TL. Earnings are coming up.SLB D1 –rejection from W1 supply, and from TL. Earnings are coming up.

Bullish inverted head and shoulders pattern SLB Bullish inverted head and shoulders pattern for SLB , lets see how it plays out.

SLB BreakoutNYSE:SLB closed above the area of value yesterday, it opened above this level. Yesterday's volume was above average. Note that it's CPI day today, anything is possible.

$SLB VCP$SLB setting up a 6 wk - 16.4/3.4 - 3T VCP pattern.
Its industry RS is currently #1
Composite and RS rating >90
Falls under the criteria of @markminervini's Code 33 screen: 3 straight quarters of accelerating earnings, sales and margins.

Variety/Targets BelowA variety of patterns.
Possible Bull Flag, possible cup and a large Rising Wedge that encompasses the trend on the recent chart.
The rising wedge (bearish if broken) is not valid as the bottom trendline has not been broken and has acted as a support line.
Price can break up from a wedge even if it is usually a short lived move.
The flag has broken the top trendline but did not do so with a "bang".
Targets if the wedge loses this battle are 57.12, 61.7. Targets 2 are 64.9 and 69.
Most of oil is in a rising wedge or is sitting over a wedge so rising wedges are common in this industry right now.
Yet they continue to rise and the bottom trendlines remain in tact for most.
There will be a reckoning at some point though. )o:
No recommendation


$SLB in a consolidation period$SLB has been consolidating since October 25, 2022 in this channel. MACD is about to turn over and sellers are cooling off. The volume is showing that a potential for a move will be ready to run soon. Profit targets are labeled in blue with entry and exit points.

Going long in Schlumberger SLBHello Traders
Schlumberger SLB - NYSE.
Broadening Wedges Ascending
Trend : Upward.
Formation : Broadening Wedges Formation (In Progress)
Possibility : Bullish continuation
Probability to hit tragedy: 69.00%
Trade Plan.
Long / Buy Trade.
Entry Level above the red support line @ 46.17
Take Profit - Below the 4 hour support zone @ 61.50
Stop Loss at the support level red line @ 41.80
Trail Stop loss on support level as trade progresses.
TP = Total PIPS in gain = 15.33 Profit 33.37%
Total PIPS in Stop loss = 4.37 Loss 10.94%
Regaards,

Pullback in SchlumbergerSchlumberger broke out to new multiyear highs last month, and now it’s pulled back.
The first pattern on today’s chart is the June peak of $49.83. Strong quarterly results drove the oilfield servicer through that level on October 21. Two retests occurred in November, but it held both times. Has old resistance become new support?
Next, SLB is currently trying to form a bullish inside week. That could suggest prices are squeezing before a bigger move occurs.
Third, stochastics are back near an oversold condition.
Finally, energy remains the top-performing sector in 2022 as crude-oil inventories dwindle. That may keep investors engaged into yearend.
TradeStation has, for decades, advanced the trading industry, providing access to stocks, options, futures and cryptocurrencies. See our Overview for more.
Important Information
TradeStation Securities, Inc., TradeStation Crypto, Inc., and TradeStation Technologies, Inc. are each wholly owned subsidiaries of TradeStation Group, Inc., all operating, and providing products and services, under the TradeStation brand and trademark. You Can Trade, Inc. is also a wholly owned subsidiary of TradeStation Group, Inc., operating under its own brand and trademarks. TradeStation Crypto, Inc. offers to self-directed investors and traders cryptocurrency brokerage services. It is neither licensed with the SEC or the CFTC nor is it a Member of NFA. When applying for, or purchasing, accounts, subscriptions, products, and services, it is important that you know which company you will be dealing with. Please click here for further important information explaining what this means.
This content is for informational and educational purposes only. This is not a recommendation regarding any investment or investment strategy. Any opinions expressed herein are those of the author and do not represent the views or opinions of TradeStation or any of its affiliates.
Investing involves risks. Past performance, whether actual or indicated by historical tests of strategies, is no guarantee of future performance or success. There is a possibility that you may sustain a loss equal to or greater than your entire investment regardless of which asset class you trade (equities, options, futures, or digital assets); therefore, you should not invest or risk money that you cannot afford to lose. Before trading any asset class, first read the relevant risk disclosure statements on the Important Documents page, found here: www.tradestation.com .

10/30/22 SLBSchlumberger N.V. ( NYSE:SLB )
Sector: Industrial Services (Oilfield Services/Equipment)
Market Capitalization: 71.538B
Current Price: $50.45
Breakout price trigger: $52.50
Buy Zone (Top/Bottom Range): $51.00-$47.40
Price Target: $61.20-$62.40
Estimated Duration to Target: 56-60d
Contract of Interest: $SLB 12/16/22 55c
Trade price as of publish date: $1.63/contract

$SLB with a Bullish outlook following its earnings #Stocks The PEAD projected a Bullish outlook for $SLB after a Positive Under reaction following its earnings release placing the stock in drift A with an expected accuracy of 40%.

SLB - New Era Rebranding - Long PositionLong position for SLB - simple plot via linear regression line - coincide with Fibonacci Retracement - making new high to the long position.
As long as the price action stay within the gray area making new high and higher high with higher low, trend is up!


$SLB Swing TradeSLB Swing Trade - Grade A
Strategy Description
• Solid earnings + Reaction
• In a very strong sector (XLE)
• Huge daily level with not much resistance until higher up
Market Big Picture
• SPX favors the upside until we break below 3638.
• Energy plays tend to diverge from SPX, so this is a comfortable swing even if the market is dying and breaks below 3638.
Intraday Fundamentals
• SLB Earnings were rock solid and the stock was up 2.7% premarket + 8% on the day
Long Term Technicals
• SLB is approaching a massive daily level at 49.83 which if broken successfully with the earnings tailwind, can see 52.94, 59.25, 63.31
⚒️ Instrument ⚒️
SLB 12/26/22 - 50C @ 3.3
🎯Targets: 52.94, 59.25, 63.31
🩸Stop: Close below 46.69 on the daily
