earnings watch 10/21earnings watch 10/21
SLB
HCA
RF
INDB
CPF
AXP
SMPL
ALV
VZ
EEFT
Do your own due diligence, your risk is 100% your responsibility. This is for educational and entertainment purposes only. You win some or you learn some. Consider being charitable with some of your profit to help humankind. Good luck and happy trading friends...
*3x lucky 7s of trading*
7pt Trading compass:
Price action, entry/exit
Volume average/direction
Trend, patterns, momentum
Newsworthy current events
Revenue
Earnings
Balance sheet
7 Common mistakes:
+5% portfolio trades, capital risk management
Beware of analyst's motives
Emotions & Opinions
FOMO : bad timing, the market is ruthless, be shrewd
Lack of planning & discipline
Forgetting restraint
Obdurate repetitive errors, no adaptation
7 Important tools:
Trading View app!, Brokerage UI
Accurate indicators & settings
Wide screen monitor/s
Trading log (pencil & graph paper)
Big, organized desk
Reading books, playing chess
Sorted watch-list
Checkout my indicators:
Fibonacci VIP - volume
Fibonacci MA7 - price
pi RSI - trend momentum
TTC - trend channel
AlertiT - notification
tickerTracker - MFI Oscillator
www.tradingview.com
SLBD trade ideas

SLB weekly indecision candleSLB weekly indecision candle pressure building nice and bearish volume exceeds bullish all the time. Had to take that one. Stop loss above local highs.

Schlumberger Is Pulling BackOilfield-services provider Schlumberger has been grinding higher for weeks. Now amid a brief pullback, it could soon offer buyers a potential opportunity.
The first pattern on today’s chart is the series of higher lows since mid-July. SLB hit resistance several times around $37.20 before breaking out on August 23. Traders may look for support to form near the top of that ascending triangle.
Next, that potentially important level is near the 200-day simple moving average (SMA).
Finally, MACD has been steadily rising. This may suggest that short-term momentum remains bullish.
TradeStation has, for decades, advanced the trading industry, providing access to stocks, options, futures and cryptocurrencies. See our Overview for more.
Important Information
TradeStation Securities, Inc., TradeStation Crypto, Inc., and TradeStation Technologies, Inc. are each wholly owned subsidiaries of TradeStation Group, Inc., all operating, and providing products and services, under the TradeStation brand and trademark. You Can Trade, Inc. is also a wholly owned subsidiary of TradeStation Group, Inc., operating under its own brand and trademarks. TradeStation Crypto, Inc. offers to self-directed investors and traders cryptocurrency brokerage services. It is neither licensed with the SEC or the CFTC nor is it a Member of NFA. When applying for, or purchasing, accounts, subscriptions, products, and services, it is important that you know which company you will be dealing with. Please click here for further important information explaining what this means.
This content is for informational and educational purposes only. This is not a recommendation regarding any investment or investment strategy. Any opinions expressed herein are those of the author and do not represent the views or opinions of TradeStation or any of its affiliates.
Investing involves risks. Past performance, whether actual or indicated by historical tests of strategies, is no guarantee of future performance or success. There is a possibility that you may sustain a loss equal to or greater than your entire investment regardless of which asset class you trade (equities, options, futures, or digital assets); therefore, you should not invest or risk money that you cannot afford to lose. Before trading any asset class, first read the relevant risk disclosure statements on the Important Documents page, found here: www.tradestation.com .

SLB upOil supply will dwindle, Russia to inflict max pain on Europe to try for instability.
Easy inverse H&S, looking for crude and oil stocks to post recovery in next 3-4 months.
Best of luck trading.

$SLB with a Bullish outlook following its earnings #Stocks The PEAD projected a Bullish outlook for $SLB after a Positive Under reaction following its earnings release placing the stock in drift A with an expected accuracy of 44.44%.


SLB (Short) - Betting on demand destruction in oil marketsThe Overall Market
The current market is extremely tricky, but it is possible to find a rational explanation for every move. I took a closer look at the oil market , which is clearly undergoing gradual demand destruction caused by the recession fears (like the recent economic news from China) Although I understand that the bigger-picture supply situation might lead to higher commodity prices in the future, demand destruction is likely to prevail in the next 3-6 months. My target range for oil is 60-70$ . The broader markets are also due for a correction after that massive run, which would give more momentum to my trade.
Fundamentals
With this view in mind, I started looking for a way to express this idea. I choose to be a little riskier, so I wanted to express the trade through a single stock short (but there are obviously many more ways to express this trade if you want to take less or more risk). Hence, I started looking for energy stocks which perform the worst on a relative scale . I arrived at SLB; a large-cap company ($50b), so don't expect too much volatility. Although the firm's fundamentals are pretty solid, its share price is not able to diverge from its strong correlation with the oil price.
Technicals
From a technical point of view, the stock gets 10/10. We saw a massive slump during June, which indicated the end of the prior trend . Since then, the stock has consolidated and returned to a very strong line of support/resistance (black line). I would suggest setting stop loss just above this line, on top of the previous high (red line). This gives a perfect risk/reward (R/R) ratio where you risk only 4% . The stock is also being approached from above by its 50 and 200 SMA. MACD is showing a bearish divergence while just turning at the 0 line. Daily RSI also nicely bounced around the 60 level and seems ready to head back to the bearish territory. If you switch to a weekly chart, you will see that the weekly RSI just broke down and looks like heading lower. I indicated two profit targets (green lines). One would give you R/R of 4:1, the other around 6:1.
Happy trading.

#SLB Base and undercut formingObserving that #SLB is forming a base and with an undercut with quick recovery. Noted that similar happened before,

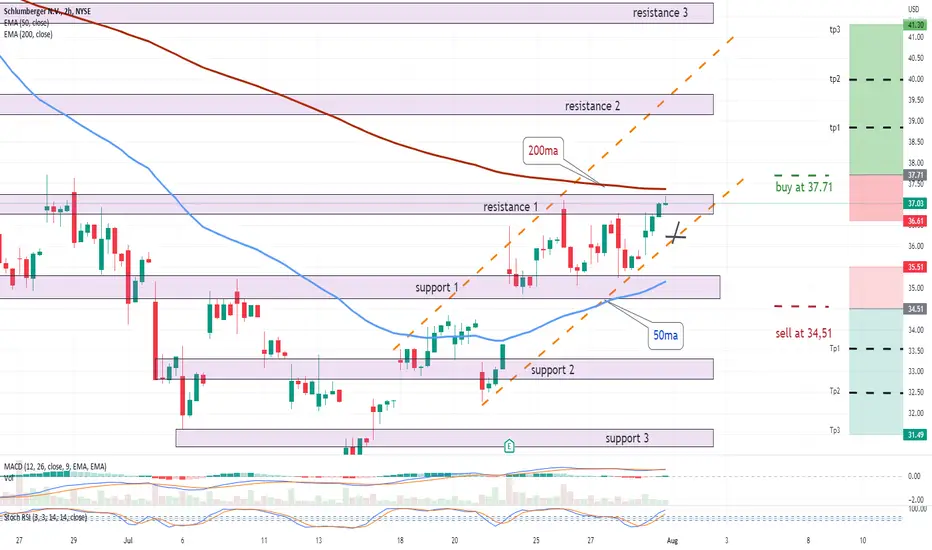
slb 2 scenariosslb 2 scenarios .. 1]buy above the resistance 1 and 200ma .. 2] sell after the break under the support 1 and 50 ma ..
SLBFamous Oil Field company is expected to increase in this upcoming month for a good gain after reversaing from a down trend. Fractal is only idication of wave movement not excact.


$DBX $LIT $AMD $SLB I OptionsSwing WatchlistDBX 1D I DBX is breaking out from a possible bull flag on the daily after rumors that it was approached a month ago in attempts to be acquired by another company.
LIT 1D I Energy stocks and lithium stocks in general have been overperforming the market for the past two weeks. Watching for a breakout from this downtrend.
AMD 1D I AMD is forming a possible bear flag on the daily time frame. We have resistance near $110 and support close to $106. AMD is breaking out from a downtrend.
SLB 1D I SLB has been holding $46. Energy stocks keep on outperforming the market, and I've seen bullish trades on some energy stocks like SLB MRO among others.

SLB Cycle Reset, Recovery Within ChannelAn idea for SLB that shows three areas in red, green, yellow (3,2,1 Respectively)
We are currently experiencing a situation that is very similar to the area in red.
A recovery back into the channel and further upwards is possible if this pattern continues to repeat itself.

Go 9. Ok 10 if you want 1$ is not that importantRegarding the move, like how i see the brent going back between 35$ and 25$ this stock should follow the huge drawdown

Is SLB ready for another run up? Is SLB ready for another run-up? RSI is near resistance and if it breaks through I can definitely see another leg up for SLB to go past the 50$ level. Next Earnings are being reported on Friday 22th and most analysts have a positive rating on SLB. Good luck trading! NFA

Triangle breakoutNice breakout last week.
Waiting for Friday's highs to be taken out and continue to push higher towards top of the triangle.

Schlumberger Holds the 50-day SMAEnergy stocks remain the leading sector in 2022. Today we’re considering another pullback in a major name: oil-field servicer Schlumberger.
Like Exxon Mobil yesterday, SLB has retreated from a multiyear high to hold its 50-day simple moving average (SMA).
SLB also made a slightly higher low this week versus earlier in the month. (Notice the trendline starting in late January.)
Finally, both of the prior lows occurred near earlier highs. The January 24 low matched the peak from late October. The March 1 bottom corresponded to last June’s high. Both times, SLB turned old resistance into new support. That also suggests bulls have taken charge.
TradeStation has, for decades, advanced the trading industry, providing access to stocks, options, futures and cryptocurrencies. See our Overview for more.
Important Information
TradingView is not affiliated with TradeStation Securities Inc. or its affiliates. TradeStation Securities, Inc., TradeStation Crypto, Inc., and TradeStation Technologies, Inc. are each wholly owned subsidiaries of TradeStation Group, Inc., all operating, and providing products and services, under the TradeStation brand and trademark. When applying for, or purchasing, accounts, subscriptions, products and services, it is important that you know which company you will be dealing with. Please click here for further important information explaining what this means.
This content is for informational and educational purposes only. This is not a recommendation regarding any investment or investment strategy. Any opinions expressed herein are those of the author and do not represent the views or opinions of TradeStation or any of its affiliates.
Investing involves risks. Past performance, whether actual or indicated by historical tests of strategies, is no guarantee of future performance or success. There is a possibility that you may sustain a loss equal to or greater than your entire investment regardless of which asset class you trade (equities, options, futures, or digital assets); therefore, you should not invest or risk money that you cannot afford to lose. Before trading any asset class, first read the relevant risk disclosure statements on the Important Documents page, found here: www.tradestation.com .

exposure to higher oil prices..!Entry: the opening price
Stop loss: closing below 36.6
Reward/Risk:
Target range: 48-50
Time Frame: 4-12wks
Possible gain: 25-30%
Possible loss: 5-7%
Position size: 5 % of trading capital
You can see the most important support(green line) and resistance (red line) levels.
Best,
Dr. Moshkelgosha M.D
DISCLAIMER
I’m not a certified financial planner/advisor, a certified financial analyst, an economist, a CPA, an accountant, or a lawyer. I’m not a finance professional through formal education. The contents on this site are for informational purposes only and do not constitute financial, accounting, or legal advice. I can’t promise that the information shared on my posts is appropriate for you or anyone else. By using this site, you agree to hold me harmless from any ramifications, financial or otherwise, that occur to you as a result of acting on information found on this site.

US Stock In Play: $SLB$SLB pennant consolidation within its high tight flag formation is still in making. on monthly, it has just barely traded beyond its breakout level of the inverse h&s pattern. textbook measured move is $53, another +37% away. ER Q4''21 (YoY)EPS 0.41 (+86%)Sales 6.22b (+13%)

SLB in between important support and resistance zonesSLB currently trading in between support and resistance zones. If we have a strong breakout of the $41 area we will most likely see further rally ahead. N.F.A

SLB - daily / weekly breakotThis chart has a daily flag breakout and a baby pennant breakout within (double whammy?) It looks like it may continue up. They also do cool stuff like autonomous drilling. Seems cool to me

Taking profits!The stock has had a great run since December but is bumping again resistance (for the time being)! I think it is time to take some profit ! Just my opinion :) However if price can clearly break above that resistance then there should be much more potential over the next few months !
