SPCE - Time for the next big move!First of all let me start out by saying that I believe that Virgin Galactic is an amazing long-term investment company, it is first of it's kind and it is start a completely new industry of space travel. Short-term things are at a key descision point. We are moving on the 1 hour chart inside a small channel, that we are most likely going to hit it's resistance and from there on we will either bounce back to the bottom of the channel which will result to drop to around 20$ . This is where it is the best long-term buy price, where you will be good to go to buy and hold for the next few years and even longer to just enjoy the huge returns. Otherwise, if we break the channel and go above 27$, we should see the price to atleast 35$ which would be the hight of the Daily triangle. On that price we are again going to have to wait for the price to decide if it will leave the triangle and go to 60-70$ or it will not break the resistance at 35$ and it will retest once again the lows of the triangle to 22-23$ and then go for the 60-70$ price. Either way, this stock is an absolute gem right now and even at 25$, if you buy and hold it's an amazing position for the next 5-10 years and longer.
SPCE trade ideas


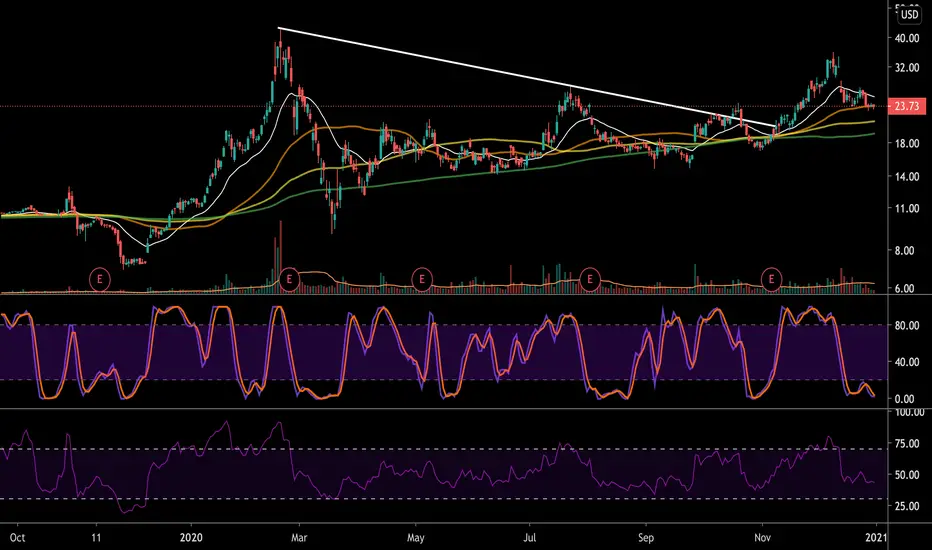
SPCE near liftoff again?Since the breakout leading to the failed test flight, SPCE might possibly breakout of the bullish wedge/triangle that has formed. Two multi month targets listed.

LONG SPCE- Watch EWO go above yellow (4 wave)
- Watch SPEED FIB RESISTANCE
- Stop 22.5
- Target 40
- Possible Entry 25+

SPCE get ready!Institutional trading works in all aspects of trading!
Wykoff Theory supports this analysis, however Elliott Wave doesn't tend to work with stocks!

LongggShows best case scenario and worst case scenario in duration either ways long this bad boy. When in doubt play both. Buy close to ITM for first date and OTM for second date.


SPCE Cube - the end of the lineright on the .5 of the lower channel - this remains on watch for 2021 as we make our way to Mars. Who is first up for the trip?
SPCE Support Low 20s, Ready for Small Bounce w/Weekly CallsGood leap candidate for space tourism catalyst with a successful flight. Not many catalyst on SPCE other than the failed flight. I don't expect any big price movement in the short term but I like this for a bounce and swing trade. SPCE likes the mid 20's and has defended the .618 fib well.

SPCE Reversal Swing TradeSPCE has been at current levels since the failed test flight in December. However, the engine failure did not result in any deaths and rather tested the safety features in a real use case. They have yet to announce another test flight but its expected within 1-2 months at most.
Price action has held the fib golden pocket and consolidated up to the ichimoku golden cloud on the daily chart. Eventually looking to fill the gap down at $31 as the first price target. Look to hold the $21-$22 zone as support.

SPCE LongEMA50 above EMA100 as Support Zone
Trendline break, Breakaway Gap
Entry 25
stop 22
Target 36
I am not a PRO trader. I trade option to test my trading plan with small cost.
The max Risk of each plan is less than 1% of my account.
If you like this idea, please use SIM/Demo account to try it.

SPCE consolidating on the hourly chartBased on the hourly chart SPCE is consolidating nicely. set up notification between support and resistance and wait for confirmation before taking the trade

SpaceX Probably Going To Outer Space. Going to outer-space looks good in these days and in the overall future. Predicting Doubling of value in 2022

Virgin Galactic SPCE Long 60%+Long idea for SPCE.
I identify a double bottom pattern on the daily chart, that may be doing a retest on the neckline (red rectangle area), which happens to be the 0.618 retracement and also a weekly support at around 23 USD.
If the retest is successful we may be looking for a 60% upside on this trade in the long term. Invalidation of this idea, is if it does not hold weekly support.
Virgin Galactic recently had a test flight, and the mission was to get VSS Unity to the space, unfortunately the objective of the mission was not achieved, but the spaceships and crew flown back and landed successfully on the spaceport without any problems, but that caused the recently price drop.
If the following test is successful SPCE will soar.
Please let me know what you think on the comments below.
Happy new year everybody!


SPCE Finished CorrectionSpce looks to be forming an inverse head and shoulders after falling in the 0.5 to 0.618 retracement zone after it's initial impulsive move. Look for break or retest of trendline


ABC BullishPrice is oushing down on C
As a rule a good place for a stop is under C. I looked and SPCE has hit 22.88 today but did not go lower
A= 17 and B = 35.82
Targets are calculated using AB leg and fib levels.
C can not go below A in this pattern
Not a recommendation

Bearish SPCE Chart Bearish SPCE as much as i am bullish on the chart i will never learn from my mistakes same exact set up BABA had that fooled me once but not again, Bearish trend-line that isn't close to breaking at all looking like a descending triangle as well, last 2 week of DEC i also saw these smaller companies get less flow into them as tech, it might be because low volume or my little theory on more money flowing into tech as we been seeing them make a move, higher risk but i see no reason to be bullish again until a launch of some sort (catalyst) not ultimate as i am not confident as this one as the others

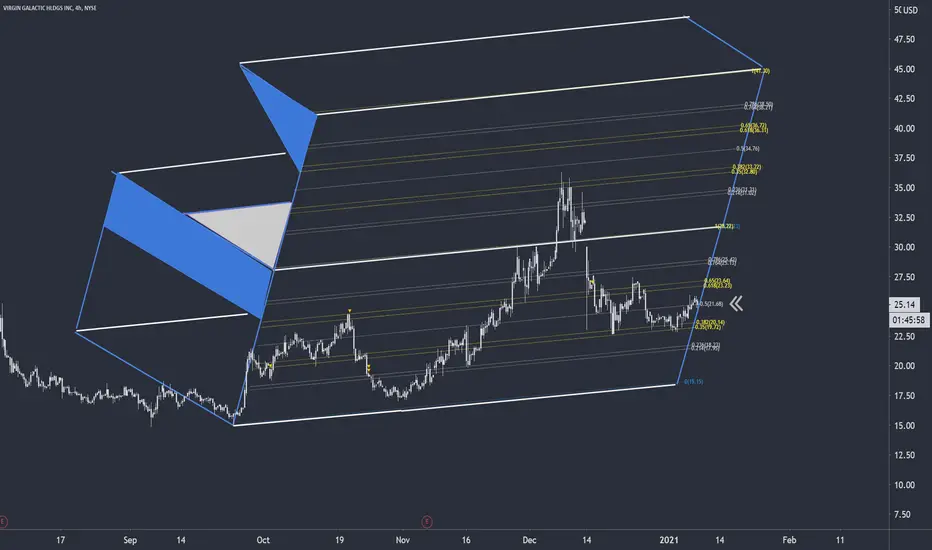
[SPCE] Touchdown SOON Before Next LAUNCH!Unloading half my stake over 4 trades at average 33 worked out quite well with Price Action completing the expected mean reversion.
I have expanded the original Value Channel (magenta) by 3x now because Price Action is holding to the uptrend very strong and I do anticipate that to continue for years. Any BUY in the Value Channel likely to be good for a solid intra-year swing trade.
I'm very tempted to start scaling back in and will if I see signs of a trend reversal here but for now especially within the overall market conditions for the next couple weeks, I'm expecting a strong chance we can load up in the Value Channel again.
Will preferably start scaling back in on a green line X and each subsequent line X after that with a capstone bet as the trend reverses or before a big event.

SPCE VirginHello receive a cordial greeting, and a thriving 2021 our wishes are that 2021 will be a fantastic year in all aspects for all people.
We believe that this action has a great bullish journey based on Technical and Fundamental Analysis. But this is not financial advice
We have as resistors the key levels of 31, to consolidate it, 35 and 37.
and as resistors the levels of 17, 15 and 12. Also on the chart there is a blue circle, it represents a GAP, this is :
Gaps are areas on a chart where the price of a stock (or another financial instrument) moves sharply up or down, with little or no trading in between. As a result, the asset's chart shows a gap in the normal price pattern. The enterprising trader can interpret and exploit these gaps for profit.
Greetings and best wishes for 2021 L.E.D
In Spain as of 12/31/2020
