Target Corporation bullish scenario:The technical figure Triangle can be found in the daily chart in the US company Target Corporation (TGT). Target Corporation is an American big box department store chain. It is the seventh largest retailer in the United States, and a component of the S&P 500 Index. The company has found success as a cheap-chic player in the industry. The Triangle broke through the resistance line on 08/09/2022, if the price holds above this level, you can have a possible bullish price movement with a forecast for the next 31 days towards 189.83 USD. Your stop-loss order, according to experts, should be placed at 157.25 USD if you decide to enter this position.
Target announced Wednesday that Brian Cornell will remain CEO for approximately three more years after the company's board voted to eliminate a retirement policy that could have forced his exit.
Cornell, 63, has led Target since 2014. Since coming on that year, Target's share price has more than doubled — and at one point was up more than 400%.
Risk Disclosure: Trading Foreign Exchange (Forex) and Contracts of Difference (CFD's) carries a high level of risk. By registering and signing up, any client affirms their understanding of their own personal accountability for all transactions performed within their account and recognizes the risks associated with trading on such markets and on such sites. Furthermore, one understands that the company carries zero influence over transactions, markets, and trading signals, therefore, cannot be held liable nor guarantee any profits or losses.
TGT trade ideas

TGTNot financial advice. The essence of investing & trading is the intelligent and patient preying on the greed, fear, impatience, addiction and ignorance of the majority. It's definitionally Darwinian.

2X $TGT 4HR Tech. Analysis!Target is at an area where it could be two possibilities. Number 1 being that it forms a hook pattern and rejects off the .786 or the golden are and dives down to $152 which is probable to happen but after it the formation plays out it reverses so i see that area as another buy opportunity! Number 2 it could break that zone and form a rounding bottom and take off to fill the gaps! Be patient trade with volume and confirmation!

2X $TGT TP1 HIT for $$9.50! (+5%)$TGT has earnings coming up and a huge +20% gap to fill, which would be a +$35 move for this week to come or even leading into next week! Price has broken resistance and is making a bullish move to the upside to fill that gap it seems! Patience is key! wait for confirmations & ride the trend!

TGT: Bullish outlook!Target
Short Term - We look to Buy at 171.59 (stop at 159.63)
This stock has recently been in the news headlines. Price action has broken from the previous formation. A weaker opening is expected to challenge bullish resolve. Neckline support is 170.00. Further upside is expected although we prefer to set longs at our bespoke support levels at 170.00, resulting in improved risk/reward.
Our profit targets will be 199.21 and 210.00
Resistance: 200.00 / 210.00 / 250.00
Support: 170.00 / 140.00 / 90.00
Please be advised that the information presented on TradingView is provided to Vantage (‘Vantage Global Limited’, ‘we’) by a third-party provider (‘Signal Centre’) . Please be reminded that you are solely responsible for the trading decisions on your account. There is a very high degree of risk involved in trading. Any information and/or content is intended entirely for research, educational and informational purposes only and does not constitute investment or consultation advice or investment strategy. The information is not tailored to the investment needs of any specific person and therefore does not involve a consideration of any of the investment objectives, financial situation or needs of any viewer that may receive it. Kindly also note that past performance is not a reliable indicator of future results. Actual results may differ materially from those anticipated in forward-looking or past performance statements. We assume no liability as to the accuracy or completeness of any of the information and/or content provided herein and the Company cannot be held responsible for any omission, mistake nor for any loss or damage including without limitation to any loss of profit which may arise from reliance on any information supplied by Signal Centre.

Earnings 8-17//A Beat Can Depend on How Low the Number Is?We sure are having a lot of earning beats as of late that are totally unexpected.
TGT is in the morning BMO.
Last quarter expectations for TGT were 2.19 a share. This quarter, expectations are .71?
WMT beat today. A bit less of a spread and last quarter the number to beat was 1.77. This quarter it was 1.27.
I suppose if you play with numbers every quarter, anyone and everyone can beat earnings?
No recommendation
$TGT back to 200?? Going into this and next week for a swing trade, I really like Target, especially on an earnings play. We have a nice continuation/ bullish trend on our linear regression channel, money momentum has been shifting higher over the past few days, along with a key EMA crossover to the upside, and we have our green middle band (indicating bull market momentum). We also had a break of structure to the buy side, and I like the continuation of this previous high break. Fundamentally, Wells-Fargo upgraded $TGT to $195, and we have dividends and a potentially positive earnings report due on Wednesday.
Will this be the spark $TGT needs to fill the gap to $212?!

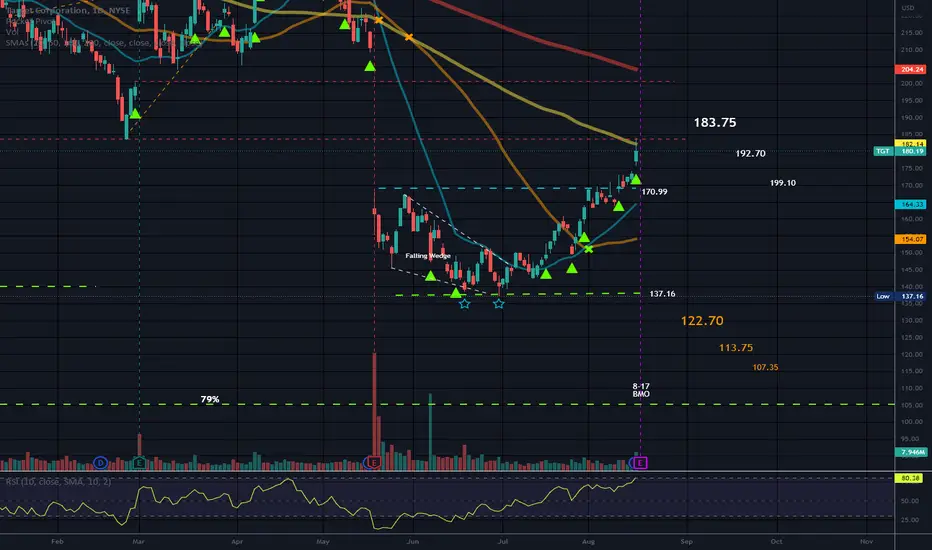
EARNINGS 8-17 BMOEarnings Wednesday before market opens.
Horizontal trading channel with price slightly above the top trendline.
Gaps overhead that may impose some resistance.
Double bottom at bottom of channel and a narrowing Falling Wedge which can be bullish when price breaks above the top trendline.
No recommendation.
Bearish Harami candle pattern right now but can change by close.

$TGT (TARGET) POSSIBLE +20% GAP FILL!$TGT has earnings coming up and a huge +20% gap to fill, which would be a +$35 move for this week to come or even leading into next week! Price has broken resistance and is making a bullish move to the upside to fill that gap it seems! Patience is key! wait for confirmations & ride the trend!


TGT Target Corporation Options Ahead Of EarningsIf you haven`t sold TGT at the previews earnings:
Then looking at the TGT Target Corporation options chain, i would buy the $182.5 strike price calls with
2022-8-19 expiration date for about
$2.93 premium.
Looking forward to read your opinion about it.

Breakout?Possible breakout for target. Looks like the 170 resistance is getting weak.
Possible move to 180, keeping an eye out tomorrow.
But its also at a point where there can be a reversal

$TGT Buy above $150 or Sell Below $142
Buy above $150
TGT-1-155
TGT-2-161
SL: 145
Sell Below $142
TGT-1-138
SL: 145
Always keep strict stop loss

BOS + LHBreak of Structure plus Lower Highs on 30 min chart
Price broke through previous days low.
Waited for pullback and brought puts on continuation to the downside.
3:1 RR

Target Watch price actionIf we can break above 150.66 and then break above 152 we can see more upside , although very unlikely . If we get rejected at either of these levels Ill be playing the downside. $$

Target missed its quarterly targetsTarget has shed off almost 50% from its peak at 267.64 in November last year. From the chart, I think the price action is likely to revisit the support at 126.29. Here, it might stage a rebound but it has to break out convincingly out of 143.71 resistance level to continue the rally.
Else, we can expect price to falls further south towards 90.65, the next support level.

$TGT - Tightening WedgeOur wedge on the four hour chart continues to get tighter.
Can play a break of this in either direction.
Upside will likely be confirmed with a break of 144, while downside is confirmed under 137.


TGT: Gap FillsTGT has hit the 1.618 fib retracement to the downside as support and I am going long here. First target is $158 and second is $167.
Not financial advice

Head and Shoulders//Possible Bounce SoonPrice is below the neckline.
Long impulse wave up and price is well below the neckline.
Short percent is 1.81%.
Price is below the bands set on 80 so possible bounce to the upside soon. Price being below the bands can be a bearish signal, but when price is stretched to the downside, it is not unusual for price to snap back in, even if temporarily. This looks risky to be long for any length of time, but a short term pop is possible. A support level is not far below price from a prior bottom.
No recommendation

needs some more time 👀nasty gap down! many names like this go sideways for a while after a big drop so be careful chasing longs or puts and wait for confirmation.
watching calls above 168.86, puts below 145.93

TGT Rectangle ConsolidationAfter Earnings Report and the massive sell-off, TGT spent the last few days in a sideways consolidation (rectangle) - One of my favorite setups.
Upside case: Above the top of the rectangle (155.81) I would go long targeting 161.50
Downside case: Below 150.95 I would go short targeting 146.
I am treating every trade as a scalp and I have not been holding any position for more than a day.

TGT: All levels of interestTGT (Target), consumer defensive play crashing on bad earnings and inflation concerns....
Weekly chart.
Now oversold. Can we go lower?
Here are the levels I'm watching to enter:
- 139.30: I'll be buying if we reach that level. If it holds it will be a long term investment for me. If it just bounces and drops, I'll be selling and looking for the next level.
- 90-82: is the second zone of interest I'm watching. If we reach this zone I'll buy stocks as a long term investment.
Trade safe.
