TSLA BUYBUY TSLA at 272.00 to 248.00, riding it back up to 470.00 to 515.00 as Profit Targets, Stop Loss is at 213.00!
If anyone likes long mumbo jumbo garbage analysis, than this is NOT for you.
Also, if you are afraid of risk, failure, and want only a 100% sure thing, than
run as fast as you can from the markets, because it is definitely NOT for you.
WARNING: This is just my opinions of the market and its only for journaling purpose. This information and any publication here are NOT meant to be, and do NOT constitute, financial, investment, trading, or other types of advice or recommendations. Trading any market instrument is a RISKY business, so do your own due diligence, and trade at your own risk. You can loose all of your money and much more.
TSLA trade ideas

Tesla rejects bull flagTesla rejected the bull flag and immediately dropped back to the weekly demand zone. I am glad I only sold one TSLL put around the base of the flag rejection retest. I have taken this opportunity to buy 1000 shares for a big swing trade here. There was a very strong bounce on my rejection target of 275.
I believe we see 330 again in no time.
My plan: 1000 shares of TSLL
Old 13$ CSP sold
new 9$ CSP solds
13$ Covered calls sold for next week x10

TSLA Swing Trade Plan – 2025-06-06⚡ TSLA Swing Trade Plan – 2025-06-06
Bias: Moderately Bullish (short-term bounce to $305)
Timeframe: 5–7 days
Catalysts: Fundstrat upgrade, government contract news, max pain magnet
Trade Type: Naked call option
🧠 Model Summary Table
Model Bias Strategy Strike Premium Target(s) Stop-Loss Confidence
Grok Moderately Bearish $290 PUT $5.15 +25–50% gain –50% premium 78%
Claude Moderately Bullish $305 CALL $23.30 $28 / $32 $18.50 75%
Llama Moderately Bullish $305 CALL $23.40 $310 spot target $295 spot break 80%
Gemini Moderately Bearish $280 PUT (entry < $308) $3.30 $6.00 $1.65 70%
DeepSeek Moderately Bullish $305 CALL $23.20 $310 / $315 $291 spot break 75%
✅ Consensus: Bounce likely toward $305 on sentiment and positioning
⚠️ Disagreements: Direction split — bounce vs. breakdown continuation
🔍 Technical & Sentiment Summary
Trend: Below key EMAs, but short-term bounce forming
Support Zone: $291–297
Resistance / Magnet: $302–305 (max pain + liquidity)
Volatility: VIX ~17.6 — neutral, supports option buying
News: Gov’t contracts + Fundstrat upgrade — potential upside fuel
✅ Final Trade Setup
Parameter Value
Instrument TSLA
Strategy CALL (LONG)
Strike $305
Expiry 2025-06-20
Entry Price $23.30
Profit Target $28.00
Stop Loss $18.50
Size 1 contract
Entry Timing At open
Confidence 75%
💡 Rationale: Strong call wall + magnet effect at $305 with improving sentiment despite daily weakness — high-risk, short-duration swing setup.
⚠️ Key Risks & Considerations
Rejection at $297–300 zone could confirm further downside
Time decay will accelerate approaching midweek — exit quickly if thesis invalidates
Negative TSLA or macro news could reverse bounce fast
Limit size to protect portfolio: risk ≤3% of account

TSLATESLA following Fib Retracement (marked on Left) as well as Fib Extension (on Right) to the T.
News is incidental.
The BIG BEAUTIFUL FIGHT may even be fake.
But Fibonacci rules!

TESLA: Long Signal with Entry/SL/TP
TESLA
- Classic bullish formation
- Our team expects pullback
SUGGESTED TRADE:
Swing Trade
Long TESLA
Entry - 295.19
Sl - 276.74
Tp -325.39
Our Risk - 1%
Start protection of your profits from lower levels
Disclosure: I am part of Trade Nation's Influencer program and receive a monthly fee for using their TradingView charts in my analysis.
❤️ Please, support our work with like & comment! ❤️

TESLA Massive Short! SELL!
My dear friends,
Please, find my technical outlook for TESLA below:
The instrument tests an important psychological level 345.78
Bias - Bearish
Technical Indicators: Supper Trend gives a precise Bearish signal, while Pivot Point HL predicts price changes and potential reversals in the market.
Target - 308.21
Recommended Stop Loss - 364.73
About Used Indicators:
Super-trend indicator is more useful in trending markets where there are clear uptrends and downtrends in price.
Disclosure: I am part of Trade Nation's Influencer program and receive a monthly fee for using their TradingView charts in my analysis.
———————————
WISH YOU ALL LUCK

$NASDAQ:TSLA is Going to SkyRocket is Inevitable.NASDAQ:TSLA
Hi
Its the Moment for Collecting and Accumulating Stocks.
From Today on wards and upto 2 to 3 Years, its goin Sky Rocket.
Dnt Miss The Rallly ......
Thanks

TESLA TO THE MOON?!! OR TO 0??We are currently developing a bullish channel, we will likely retest the resistance of it at around 317-322 then head up to our FVG zone around 336-343. I am holding options for that very position. For long term stock holders, this is where things get interesting. Tesla is headed to the moon whether you like it or not. Probably the stock as well as the car, haha. So I am predicting at least 60000 per share in the long run. This may seem crazy to some but others will understand. AZO is the most consistent stock and has got 50000% of what it used to be. Tesla will be the next auto one but by far better. Tesla will get dominance in the global EV market. Their self driving cars will bring tremendous revenue, they have pretty much no competition either.
They don’t stop here though. Tesla isn’t just a car company. Their energy division (solar, batteries) will overtake traditional utilities.
Tesla is also trying to expand into robotics and AI at an unprecedented scale.
Hyperloop, Neuralink, and other Musk-affiliated companies also somehow contribute to Tesla's valuation which are all successful.
Now the recent “feud” with Trump and Elon may have some worried about Tesla. But as infouential as he is, he is only president for 4 years total. Elon has way more control and is here to stay. That feud means nothing long term, all it does is put Tesla on sale for a week or two. Buy now. Good luck traders. Do your own research please.

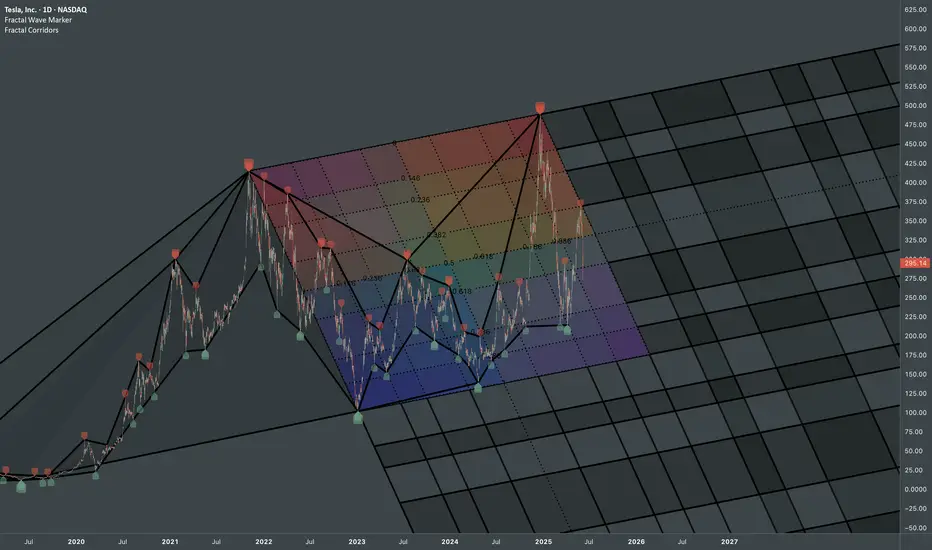
Tesla: Interconnected ATHsStructural update to:
Chronologically connecting pivots via fib channels creates a probabilistic map that captures the rhythm and scale relationships inherent in systematic price movements.
Fractal Wave Marker & Fractal Corridors were used to transform raw price data into a coherent, multiscale structure. Combo of those indicators makes you actually pay attention to ongoing patterns and get an idea how formations on smaller scale can be part of a bigger structural narrative.
Start of double bottom or bullish reversalPrice is nearing the trendline. If it crosses trendline, it will have to come back to test it before going further bullish. If it gets rejected at trendline, it could form a double bottom before testing the trendline again.

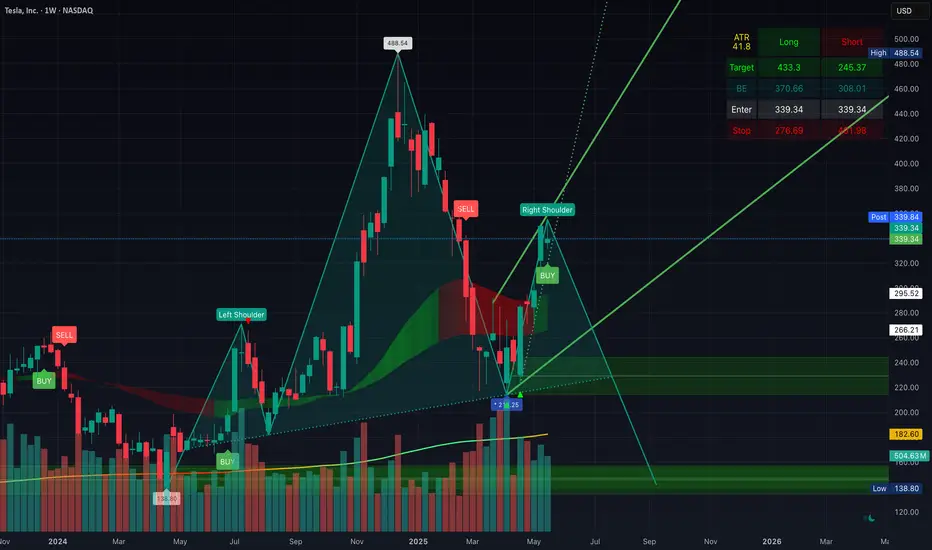
Potential Head & Shoulder Forming On The WeeklyPotential Head & Shoulder Forming On The Weekly... Facing still resistance at the $350 area, and should retest support at $280 within the coming days/weeks. If 280 breaks, should retest $240 (the h&s neckline) and could crash to $100 if that doesn't hold.
Time to take profit/hedge imo
TESLA RECOVERY AHEAD|LONG|
✅TESLA lost more than 25%
On the Elon VS Trump fallout
In less than a week which is
Seen by many as an excellent
Opportunity to add TESLA stocks
To their portfolios with a great
Discount which is why we are
Already seeing a nice rebound
From the wide strong horizontal
Support just above 270$ level
And as we are locally bullish
Biased we will be expecting
Further growth on Monday
LONG🚀
✅Like and subscribe to never miss a new idea!✅
Disclosure: I am part of Trade Nation's Influencer program and receive a monthly fee for using their TradingView charts in my analysis.

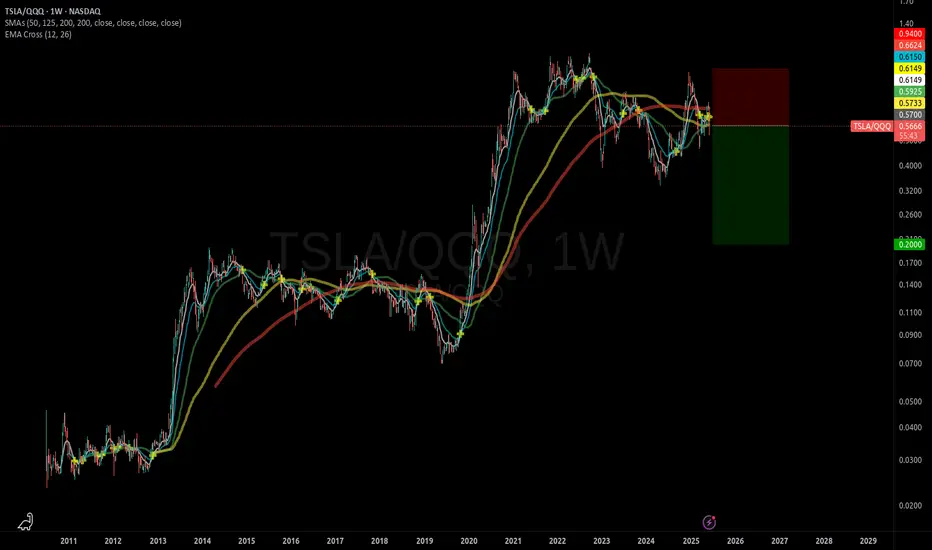
Short TSLA, Long QQQTSLA is expected to under-perform the QQQ ETF.
Whether it goes up or down in price, this trade will make money as long as the Nasdaq-100 index is stronger than TSLA.
VERY WIDE stop-loss is required.
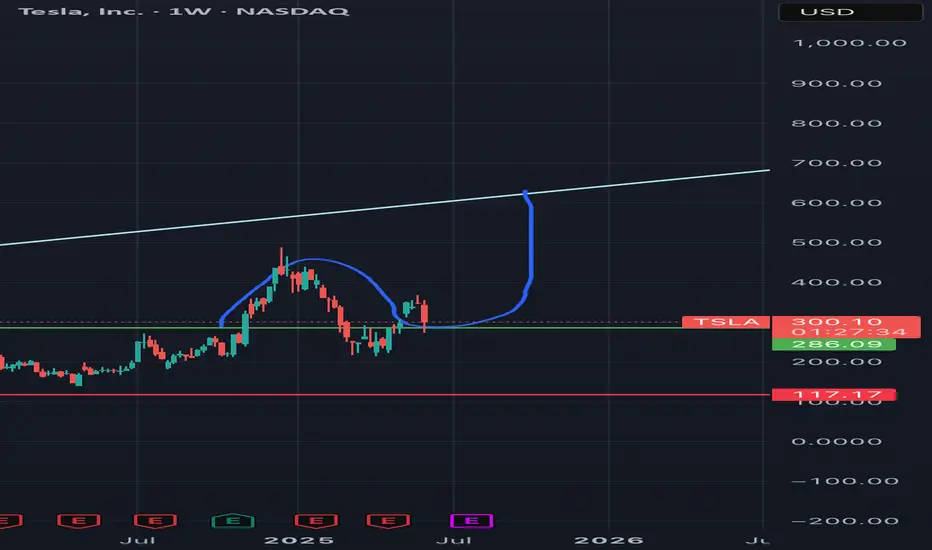

$TSLA - Time to BUY (F to sellers)When weak hands sell in fear, we proudly buy.
Tesla is at the perfect spot for buying right now, both from fundamental and technical sides. The recent fight between Elon & Trump granted so much needed correction to the chart. The price is resting on the $260 - $280 support now - ideal spot for buying before the massive blast off will happen.
A few technical factors: there is a HUGE ascending triangle with horizontal resistance ($415), the 3rd approach of this resistance should be final before the breakout happens! Moreover, the price is steadily forming a bullish pennant that will help in breaking the resistance up.
The overall trend is strictly bullish according to Fibo. The target of this upward movement is located in the $900 - $1000 zone which is x4 from current points. Not very often in our century you get such an opportunity.
You may have different opinions about Elon Musk, but you can't deny the fact he is brilliant businessman and entrepreneur. You can already see that "Tesla owners are scrambling to remove their anti Elon stickers from their car now that he is feuding with Trump" . Elon is a good-guy for liberals again, while republicans didn't change their positive attire regarding his company as well.
I tend to believe that all those news we witnessed yesterday (mean Elon&Trump fight) was just a part of a bigger plan , the outcome of which we will see later this year or even next year.

$BULLISH STRATEGY - SIMPLE BUT OFTEN USEFUL !This simple Strategy says when a trend has been shaped already the Second time which price hits the channel would be the most powerful wave can break even a static level !

TESLA Is it a good buy after the Trump - Musk clash?Tesla (TSLA) lost $150 billion yesterday, closing the session down by -14%, following President Trump's public feud with its CEO Elon Musk. Trump responded to Musk' criticism over the new tax bill, claiming that Musk was upset because the bill takes away tax benefits for electric vehicle purchases.
The obvious question that arises for investors is this: Is Tesla still a buy?
Quick answer? Yes. And once the dust from the fundamentals/ news settles, the technical patterns will prevail.
The long-term pattern since the January 03 2023 bottom has been a Channel Up. The recent April 07 2025 Low has been a Higher Low on this pattern as, even though it didn't touch the Channel's bottom, it did triple bottom on the 0.236 Fibonacci Channel retracement level.
This kick-started the new Bullish Leg of the pattern and yesterday's correction may be nothing more than the start of a Bull Flag formation, similar to those that took place half-way through both previous Bullish Legs.
You can even see how similar the 1W RSI patterns are among the 3 fractals, which have been Accumulation Phases before the start of the 2nd part of the Bullish Leg.
Even though the 1.618 Fibonacci extension is a technical possibility, we can settle for a $600 Target, which would fulfil the conditions of keeping the price action within the Channel Up by the end of the year.
-------------------------------------------------------------------------------
** Please LIKE 👍, FOLLOW ✅, SHARE 🙌 and COMMENT ✍ if you enjoy this idea! Also share your ideas and charts in the comments section below! This is best way to keep it relevant, support us, keep the content here free and allow the idea to reach as many people as possible. **
-------------------------------------------------------------------------------
💸💸💸💸💸💸
👇 👇 👇 👇 👇 👇

Will Tesla keep dropping?Tesla's stock experienced a significant decline of 14% yesterday, primarily due to a public feud between CEO Elon Musk and President Donald Trump. This dispute has raised concerns about potential government actions that could adversely affect Tesla's operations.
The conflict began when Musk criticized a proposed tax and spending bill, labeling it a "disgusting abomination." In response, President Trump threatened to terminate federal contracts with Musk's companies, including Tesla and SpaceX. This escalation led to a sharp drop in Tesla's stock price, erasing over $150 billion in market value and removing the company from the $1 trillion market capitalization club.
Technical analysis indicates that Tesla's stock broke below key support levels, including its 50- and 200-day moving averages, suggesting a potential continuation of the downtrend. Analysts have identified support levels at $265, $215, and $170, with resistance around $365.
Despite the recent turmoil, some analysts remain optimistic about Tesla's long-term prospects. Dan Ives of Wedbush Securities maintains a bullish outlook, citing upcoming innovations like Tesla's robotaxi service as potential growth drivers.
However, challenges persist. Tesla faces declining sales in Europe, increased competition from companies like BYD, and potential regulatory hurdles stemming from Musk's political engagements.
-Disclaimer: This analysis is for informational and educational purposes only and does not constitute financial advice, investment recommendation, or an offer to buy or sell any securities. Stock prices, valuations, and performance metrics are subject to change and may be outdated. Always conduct your own due diligence and consult with a licensed financial advisor before making investment decisions. The information presented may contain inaccuracies and should not be solely relied upon for financial decisions. I am not personally liable for your own losses, this is not financial advise.

Tesla Update Longs and shorts At the start of the video I recap my previous video and then bring us up to date with the present price action .
In this video I cover Tesla from the higher time frame and breakdown both a long term bullish scenario as well as a local bearish scenario .
Both of these scenarios present longs and short entries for day trade opportunities and swing positions .
Tools used Fibs , TR pocket , Volume profile , Pivots , and vwap .
Any questions ask in the comments
Safe trading and Good luck

TESLA JUN 2025Tesla ( NASDAQ:TSLA ) rejected from the $305–$350 resistance zone after a strong rally.
Price is now testing the lower end of the previous breakout range, with potential for deeper retracement.
Below $305, the next key support lies in the $250–$220 accumulation zone, where $23B was previously bought.
If this level breaks, watch for possible institutional defense at $200 and $180 weekly, where large orders are sitting.
On the upside, a confirmed breakout above $350 could open the path toward the target zone at $500, although strong resistance is expected between $500–$550, where $55B was previously sold.
#TSLA #Tesla #StockMarket #Trading #VolumeProfile #TechnicalAnalysis #WallStreet
#globaltrade #investment #investing #stockmarket #wealth #realestate #markets #economy #finance #money #forex #trading #price #business #currency #blockchain #crypto #cryptocurrency #airdrop #btc #ethereum #ico #altcoin #cryptonews #Bitcoin #ipo

Tesla Drop to the downside update In this video I recap what happened in the latest drop on Tesla and how we anticipated this move some 4 days ago .
I cover whats possibly next for tesla looking forward .
This video also covers a HTF perspective on the direction of Tesla .
Any questions ask in comments
Thanks for your support

TSLA at an inflection pointNASDAQ:TSLA weekly chart shown wirh Mcginley indicator (a trend following indicator) and cycle oscillator. Whilst price currently shows a negative bias, I believe price has reached an inflection point as the market seeks direction. Those waiting to buy the dip should wait patiently for entry opportunities upon confirmation of momentum and volume.
