Tesla (TSLA) – From EV Giant to Tech & Energy Ecosystem Titan Update Summary:
Tesla NASDAQ:TSLA continues its transformation beyond vehicles, building a vertically integrated platform across mobility, energy, AI, and infrastructure. We maintain a bullish stance above $270.00–$275.00, with an upside target of $470.00–$480.00 based on multi-revenue stream expansion and high-margin software/service potential.
🧩 Key Growth Catalysts:
🔌 Supercharger Network Monetization
Now open to non-Tesla EVs, creating a recurring infrastructure revenue stream
Margins likely higher than vehicle hardware—similar to SaaS economics at scale
Reinforces Tesla’s ecosystem lock-in and increases brand leverage
🤖 Robo-Taxi & FSD Platform
Robo-taxi launch expected in late 2025/2026 could redefine Tesla as a Mobility-as-a-Service (MaaS) provider
Software-like margins from Full Self-Driving (FSD) subscriptions and usage fees
Establishes a powerful network effects moat
🔋 Energy + AI Synergies
Growth in Powerwall, Megapack, and solar deployments
Custom AI chips powering FSD could open new B2B licensing opportunities
AI + energy + hardware = long-term defensibility and scalability
🌍 Macro Support:
Global EV penetration projected to exceed 45% by 2030
U.S. and EU incentive tailwinds + rising fuel costs accelerate EV demand
Rising demand for grid-scale energy storage bolsters Tesla Energy segment
📈 Trade Setup & Price Targets:
✅ Entry Zone: $270.00–$275.00
🎯 Target Range: $470.00–$480.00
⏳ Time Horizon: 6–12 months (event-driven upside with robo-taxi and earnings catalysts)
🧠 Investment Thesis Summary:
Tesla is no longer just an automaker. It’s an ecosystem-first, AI-powered energy and tech company building infrastructure, platforms, and software at scale. The convergence of hardware, energy storage, and autonomy makes TSLA a rare multi-vector growth story with a durable long-term edge.
#Tesla #TSLA #EV #FSD #MobilityAsAService #EnergyStorage #TechEcosystem #BullishBreakout
TSLAD trade ideas

Tesla reclaimed spider trendsMade a sizable entry last year when daily RSI was bottomed.
Double downed and picked up more around $256.
Price bounced off Spider support trend lines and broke through resistance trend lines.
Elon posted this in march 2025:
x.com
Expecting to see 2,000$ within 3-5yrs.
NFA.
TESLA Under Pressure! SELL!
My dear followers,
This is my opinion on the TESLA next move:
The asset is approaching an important pivot point 349.84
Bias - Bearish
Safe Stop Loss - 369.27
Technical Indicators: Supper Trend generates a clear short signal while Pivot Point HL is currently determining the overall Bearish trend of the market.
Goal - 312.75
About Used Indicators:
For more efficient signals, super-trend is used in combination with other indicators like Pivot Points.
Disclosure: I am part of Trade Nation's Influencer program and receive a monthly fee for using their TradingView charts in my analysis.
———————————
WISH YOU ALL LUCK

Tesla Stock Soars 60% in 4-Week Winning Streak. Should You Buy?With global trade tensions easing and the outlook clearing up a bit, especially with next month’s robotaxi launch, Tesla bulls are jumping right in to buy the dip and ride out a four-week rally. Is there more to that? Let’s find out.
Tesla NASDAQ:TSLA just pulled off a move most gym bros would call “bulking season.”
The stock is up 60% over the past month. That’s not a typo — it’s a full-on, pedal-to-the-metal rally that’s left shorts scrambling and bulls fist-pumping like it’s 2020 again.
In just four weeks, Elon Musk’s EV maker ripped higher with the kind of velocity typically reserved for SpaceX rockets or Dogecoin bonanzas.
But now that we’re at cruising altitude (and even dipped a little bit again first thing on Monday), the obvious question floats in: Should you still be buying this? Or is this just another one of the speculative dopamine-driven dead-cat bounces?
Let’s plug in, charge up, and break it down.
💡 From Earnings Letdown to Elon Euphoria
The move started innocently enough — with bad earnings. The first-quarter report disappointed Wall Street — revenue came in light. Margins shrank. Deliveries were meh. (Mandatory “keep an eye on the earnings calendar ” remark!) Most companies would’ve been punished after such a showing.
But Tesla is not like most companies.
Instead of spiraling, shares soared 18% the week after the report — because, surprise, Tesla said it will stick to its promises. The company reiterated plans for a lower-priced EV (a Tesla for the masses), and doubled down on its robotaxi rollout, the Cybercab, slated to launch in Austin, Texas, this June.
Cue the retail stampede.
Investors didn’t see a company in trouble. They saw a growth story still in motion, with enough Muskian magic to keep hope (and valuations) alive. Tesla didn’t need to crush numbers — it just had to convince traders it hadn’t stalled out.
Mission accomplished.
🤙 Macro Tailwinds and China’s “Chill Pill”
Tesla didn’t rally in a vacuum (though that sounds like an Elon side project). The broader market has been in risk-on mode lately , helped by:
Easing China–US trade tensions , which is great news for Tesla’s Shanghai Gigafactory and its global supply chain.
A less hawkish Fed narrative against the backdrop of cooling inflation , making growth stocks slightly less allergic to rising rates.
Renewed optimism around AI and automation, both of which Tesla has front-row seats to.
Tesla benefits from all of these themes. It’s not just a car company — it’s a tangled web of EVs, robotics, self-driving tech, and Elon’s very public moonshots. When macro winds are favorable, Tesla catches more than its fair share of breeze.
📊 Technically Speaking: Breakouts and Burnouts
From a chart perspective, the move has been textbook FOMO.
Tesla sliced through its 50-day, 100-day and 200-day moving averages like butter. Volume popped. Momentum soared. And it finally reclaimed the $300-350 zone that acted like a gravitational sinkhole for months. In other words, Tesla is back above the $1 trillion valuation handle.
Is there a flipside, though? The chart’s showing signs of overextension. RSI is flirting with overbought territory. Momentum is hot — but not sustainable forever.
That doesn’t mean you short it. It just means don’t chase it like it’s a Black Friday deal on dual monitor setup.
🔎 Valuation? Let’s (Not) Talk About That
Oh right, valuation. That inconvenient little thing.
Tesla is still trading at eye-watering multiples. Forward price-to-earnings (P/E) ratio? North of 170. Tesla’s profits peaked in 2022 and have since been tumbling. But who cares — compared to traditional automakers, Tesla is operating on a completely different planet.
Analysts are eyeballing earnings per share for 2025 to land at $3.30. Even if markets were to slap a 50x forward P/E ratio, it would give Tesla a valuation of $165 a share and still be at a premium.
And to be fair, bulls will say that’s exactly the point. Tesla isn’t a car company. It’s an AI platform with a vision for the future. An energy business. A robotaxi empire-in-waiting. Maybe even a sentient Mars colony someday.
So… the price doesn’t have to make sense — if you buy the vision.
But if you’re looking for fundamentals, well, they’re still catching up.
🚗 The Robotaxi Wildcard
Let’s talk robotaxis.
Tesla’s robotaxi launch next month could be a game-changer — or a meme. If it works, and the Cybercab is a success, even in a limited beta, it will validate one of Elon’s long-promised, never-quite-delivered moonshots . It opens the door to software revenue, recurring cash flows, and the holy grail of auto tech: mobility-as-a-service.
If it flops? Well, it won’t be the first time. But this time, the market has already priced in success.
That’s risky.
🧐 Should You Be Buying?
No one ever went broke taking profits. And if you rode this 60% move, pat yourself on the back and consider trimming. It doesn’t make you a bad long-term investor. It makes you a responsible one.
If you missed it? Don’t FOMO in at the top (but also — who’s to say that’s the top?). Tesla’s chart has looked like this before — only to collapse in a pile of overhyped press releases and supply chain “hiccups.” But if you see a pullback or at least some consolidation? Great trades are about patience, not hot takes.
❤️ Bottom Line
Tesla’s four-week tear is impressive. It’s got narrative fuel, technical follow-through, and macro support. But that doesn’t mean it’s an all-you-can-eat rally buffet.
Tesla is still a volatile beast with sky-high expectations and a CEO who can tank the stock with a tweet or an Oval Office speech. It’s also a company that might reinvent urban transport next quarter.
So what’s the play? Are you ramping up your long bets on the volatile EV stock or you're more of a waiting-for-the-pullback trader? Share your thoughts in the comments!

TESLA LONGWe are going long here, good place to jump in and we expect some decent upside. Combo of FA and TA

Will the $349.98 Rally Lead to Breakout Momentum?Direction: LONG
Targets:
- T1 = $365
- T2 = $380
Stop Levels:
- S1 = $340
- S2 = $330
**Wisdom of Professional Traders:**
This analysis synthesizes insights from thousands of professional traders and market experts, leveraging collective intelligence to identify high-probability trade setups. The wisdom of crowds principle suggests that aggregated market perspectives from experienced professionals often outperform individual forecasts, reducing cognitive biases and highlighting consensus opportunities in Tesla.
**Key Insights:**
Tesla continues to dominate the EV industry with strong forward momentum in its technological advancements and market position. Current price levels exhibit resilience following a 17% surge over the past week, and strong institutional inflows signal continued bullish sentiment. Positive catalysts, such as increased adoption of autonomous driving technologies and expanded partnerships in energy storage, underpin Tesla's growth potential. However, inventory constraints and near-term market volatility could serve as temporary headwinds, making risk management critical for long-term investors.
High trading activity indicates robust interest at current levels, aligned with analyst expectations of Tesla outperforming broader market indexes. With recent announcements on Tesla's full self-driving software updates, analysts anticipate significant revenue growth from software subscriptions.
**Recent Performance:**
Tesla’s stock has rallied significantly, climbing from $298 to $349.98 within a week, supported by institutional buying and optimism surrounding its product pipeline. Despite short-term profit-taking, investor confidence in Tesla remains intact. The stock has consistently outperformed its peer group in the EV sector and showcased stronger relative strength compared to the S&P 500 during this bullish phase.
**Expert Analysis:**
Market experts have emphasized Tesla's leadership in scaling EV production and its focus on expanding its global footprint in the energy and automotive sectors. Technically, Tesla’s stock shows robust momentum, with sustained buying above key support levels and the 50-day moving average. Analysts project $365 as the next crucial target, with $380 representing a longer-term breakout level fueled by operational milestones and strategic initiatives. Key concerns include supply chain shortages and potential regulatory changes, but Tesla’s innovation pipeline remains unmatched.
**News Impact:**
Several news-driven catalysts make Tesla an attractive trade. Recent partnerships, such as the integration of Tesla vehicles into ridesharing networks, strengthen its brand presence. Additionally, reports of Tesla focusing on battery capacity improvements and securing lithium supplies boost confidence in scalable production. These developments suggest continued upside potential amid growing global EV demand.
**Trading Recommendation:**
Tesla's current price offers an excellent entry point for a bullish long-term position, with upside targets of $365 and $380, supported by strong fundamentals and sector leadership. Tight stop-loss levels at $340 and $330 allow effective risk management in case of near-term volatility. Investors should focus on Tesla’s long-term growth trajectory, robust technical setup, and improving macroeconomic conditions that favor EV adoption.

Is TSLA Going Strong Bullish?I believe we have seen the bottom of TSLA. And we are not going below 222 again.
TSLA has been through some difficult corrections, which can be read in many different ways.
After spending some time studying the 3-waves and 5-waves since the top in November 21, I believe I have a strong case in my reading, and I believe Elon is going to make TSLA a bullish stock again.
We are right now in a wave 1, so there will be a small correction soon, but I don't believe we will go below 222 again.

Tesla - Was I Wrong about the Big Short or Early?So far I have been wrong about the outlook for Tesla. I am not sure how a company can do so poorly but the stock price continue to rise. Am I wrong about the Big Tesla Short or am I early? Some say being early is the same as being wrong. What are your thoughts about Tesla? Does the future of humanoid robots and driverless taxis outweigh the companies current state?

Tesla upside bias with every dip is a buying opportunity18 May 2025
As I've consistently highlighted, every dip in Tesla has been a buying opportunity. Congratulations to those who accumulated when the price was around $250 or below—you should now be sitting on a positive P&L.
The trend remains strong. As long as momentum holds and Tesla breaks above the $300 resistance, we could see a move toward $400+ in the near term.
Strategy: Continue to hold and ride the trend.

TSLA is about to fly as NVDA
After a long basing, we finally have our runway to fly to new heights...
Same as NVDA did...
Yes... Maybe Elon is not popular, but popular does not produce and drive money.
LOGIC does. And if you saw his robots... You know you want one...
Think about the potential it has!
Everywhere there is a HUMAN, and it is supposed to function as HUMAN...
How many humans are in the world?
How many of them are working in factories?
Now imagine you don't need to pay pension, social rights, food... to those robots... and there is only a cost for maintenance and electricity... 24hr work....
Factory workers...
Mall guards...
Private property security guards...
High risk danger activities...
THE GROWTH POTENTIAL IS BILLIONS...
Think about the growth of cars...

TSLA bulls - Do You Have More?Tesla has had a stunning rebound , the chart has gone vertical right into a key resistance.
It's amazing how price action can respect key Fibonacci levels.
A 50% retrace can be observed on this chart. We all now Tesla can move in parabolic fashion but typically when it does tbag it's prone to large drawdown.
Ideally bulls would want to see price trade sideways to lower form here in setting up the potential for the next leg to $380
If price moves to quickly through this 50% Fib level expect a large reversal down.
I personally wouldn't buy up here as the bullish inverse head and shoulders from it's lower base has achieved its upside.
We need a new pattern to form and right now we haven't established a new bull flag of pattern of consolidation. NASDAQ:TSLA

Tesla is AI, Robotics company. Here is data for $6000 by 2032Hey, what's up, traders, investors and Elon Haters.
I know a $6000 will might sound controversial, and it will be hard to agree with Elon Haters. But before you put your hate on here, read the data. My goal is not to convince you or prove to you that you should invest. All these predictions can go wrong. Investing has happened many times in history, and big companies have gone bankrupt. Although many are calling this for Tesla. I don't think it's gonna happen.
📍Let's start with the fact that Tesla is not a Car company anymore, as many still value it this way.
If you look at their products and the revenue, it's broadly changing. In 2026, less than 50% income will be from the Auto business.
🧪Tesla represents a multifaceted technology powerhouse extending well beyond EVs. Its leadership in AI, Robotics and integrated hardware-software systems, alongside its unmatched margins. They are a long-term innovator in clean energy and autonomy.
🧪The business model integrates 4 colliding S-curves, which will revolutionise transportation safety and efficiency and transform industrial automation.
1) Electric Vehicles
2) Energy Storage Solutions
3) FSD / Robotaxi
4) Robotics - Humanoids
📍The first 2 in the list above are pretty much becoming the same as their Auto business and it will overextend in the next years.
📍Now let's add potential revenue from the Robotaxi. It will enormously overtake all of those
You might be wondering how? Or thinking about competitors. In fact, there is no competitor; every other company which is in this business need suppliers for servicing the cars. Tesla creates everything by itself autonomously. Their cost per mile will be the cheapest on the market in comparison with Waymo, Uber some calculations show that it can be even cheaper than driving your own car.
📍Now let's add potential revenue from Optimus.
You can see its multiple times bigger than everything. Humanoids are a 50 trillion dollar business. Why? The world is short of workers and declining birth rate. The world needs workers. The first use case for humanoids will be manufacturing, they are the best way to supplement all of that.
📍What if that doesn't play out?
All of this is still just predictions, and anything can happen. In the chart below, Cern Basher (find him on X) shows how the probability of potential business affects stock prices.
Watch the top lines. Autos, Energy, and Storage are playing out. But what if Tesla makes only 10% of the Robotaxi and Optimus, and completely fails in AI? What would be the stock price?
If Tesla completely fails in Robotaxi and Optimus and delivers only 10% of the projected stock price still can reach $3590. Which is still not bad, right?
📍But if everything plays out as projected, here is the potential revenue from Optimus.
📍Optimums will not only replace workers but also save a lot of costs for the companies
Elon Musk: This year, we will hopefully be able to make about $5000 in Optimus Robots. We are technically aiming for enough parts to make 10,000 to 12,000. But since it's a totally new product, everything is totally new, I'll say we're succeeding if we get to half of the 10,000.
Here is what it could mean for the stock price. Because I'm mainly a technical trader, not a fundamental and data expert, I like to use data from analysts and experts on Tesla.
Note: it's price projections, not predictions.
🎯 Cern Basher approx 7K by 2032
🎯 James - InvestAnswer - $6500 by 2032
🎯 When to buy?
First of all, you need to decide if you want to trade or if you are an investor. For a trade, there was a perfect technical setup at $200 which I posted around a month ago and was hated for that. Because many people are influenced by the media.
As an investor with a long-term horizon, you don't need to find a perfect entry or timing. You don't use leverage and have your long-term vision. I have been buying at $150, I bought at $450, and I bought big time again around $215, and I will buy on Monday at $350 and in future I will buy at $1000 again.
My strategy is to split profits from short-term trading into long-term investments - BTC and Tesla.
The Robotics, Autonomous Driving, and AI are disruptive technologies and S curves playing at the same time. The biggest revolution in human history is going on now. Tesla could potentially be part of it, and if all works as projected. Tesla will be bigger than the top 5 companies on the Nasdaq Combined.
David Perk
Looking for constructive discussions and opinions.

Tesla Inc. Stocks & Crypto: We Are All One!What one does, the rest follows.
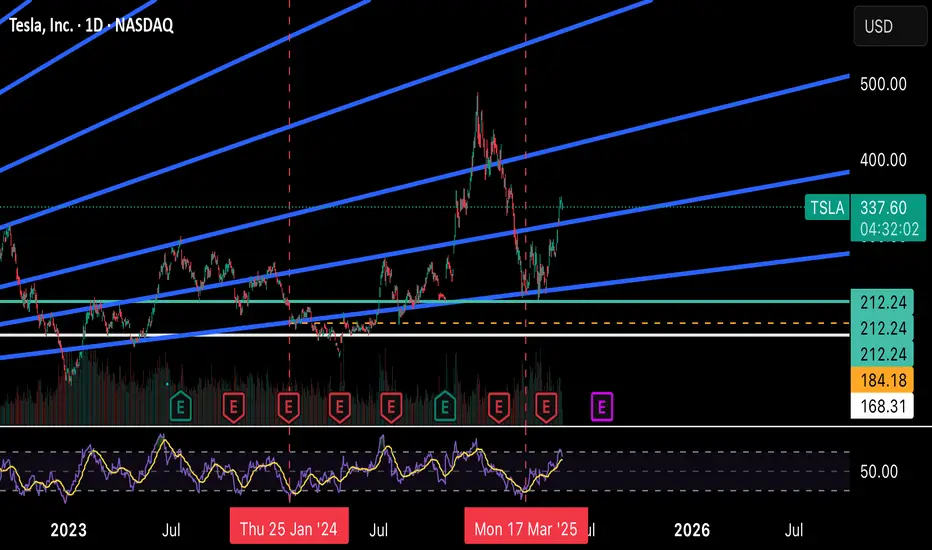
Tesla (TSLA) hit bottom in January 2023. It has been moving within a rising channel, higher highs and higher lows since.
Volume was moving down until December 2024. The drop in volume was the preparation for a correction. Volume has been rising and 7-April 2025 produced the highest volume since February 2023.
Here is the thing, when the highest buying came in February 2023, it was the start of this major bullish dynamic, the rising channel. Now volume starts to rise again after a major low (a higher low by the way). This means that we are set to experience another phase of growth, reaching new highs compared to December 2024 and in December TSLA produced its All-Time High. This means that the current bullish wave, brand new, will end in a new ATH in a matter of months. Isn't that great?
Knowing that Tesla is growing and set to continue growing, we know that all related markets or those that have a positive correlation with this one will also grow; What one does, the rest follows.
Thanks a lot for your continued support.
Namaste.

Tesla at a Tipping Point – Bear Market Rally or Final Push?The chart of Tesla Inc. (TSLA) on the daily timeframe shows a potential major top formation and subsequent range-bound consolidation, hinting at possible exhaustion. Let's break it down technically:
1. Topping Zone (Marked Purple Box)
This upper zone (~$380–$460) represents a distribution area:
Volume: Notice the volume declines slightly during the uptrend, suggesting weakening conviction on the rally. Followed by increased red bars during the drop – classic distribution.
Price Action: A blow-off move to the top followed by lower highs. This indicates buyer exhaustion.
2. Consolidation Range (Marked Yellow Box)
After the drop, TSLA enters a range between ~$240 and ~$350:
This is a classic bear flag / rectangle, and often follows a top pattern.
It looks like lower highs and higher lows are forming, but price has just returned to the upper end of the range.
We're now testing the upper resistance ($360), which is a decision point for either breakout or rejection.
Conclusions
Current volume remains muted during the recovery, which is not bullish. A true uptrend needs rising volume. Volume pattern supports a “bear market rally” narrative.
If we pull a Fib from the top (~$460) to the bottom (~$240):
The current level (~$342) aligns closely with the 61.8% retracement, a classic reversal zone in downtrends.
Strong resistance is expected around this area.
Moving Averages (50D & 200D):
The 50-day MA is curving up from below, and price might be hitting resistance.
The 200-day MA is overhead, it creates a death cross scenario in past data.
🔔 Summary – Are We at a Top?
Yes, this looks like a potential short-term top within a broader bearish context.

MicroStrategy buy gold pair trade I want to fair trade microstrategy and Tesla. I want a chart so I can see when to buy Tesla and sell micro strategy in conversely sell microstrategy and by Tesla shares

$TSLA KEY Fibonacci Updates Long from 250 NAILED ITWe went long at 250 and NAILED IT
However, WATCH the GOLDEN ZONE short starting at 350 for a potential stall or retracement
I will be looking to add on ALL DIPS!
DROP A LIKE for live updates!

TSLA long levels 1st target 363 & 2nd target open daily gap 401TSLA long levels 1st target 363 & 2nd target open daily gap 401

$TSLA Weekly Chart Analysis🚀 NASDAQ:TSLA Weekly Chart Analysis
🔹 Strong Momentum: Launching off the volume shelf and cruising with the market’s bullish energy.
🔹 Room to Run: Approaching the red barrier, but not there yet—still has upside before a pullback.
🔹 Healthy RSI: Sitting at 56.60, meaning plenty of room for further gains.
🔹 Catalyst Ahead: Robotaxi event incoming! (Sell the news? You bought the rumor. 🤔)
🔹 Key Resistance: Watch levels at $350–$400.
Stay sharp—let’s see if TSLA keeps charging forward! ⚡📈

Tesla The Power of Candlesticks in Action!
On this Tesla (TSLA) chart, we’ve spotted two bullish candlestick patterns—but will they spark upside momentum? 📈
Will buyers step in on this signal, or is there more downside ahead? 🤔
From Bitcoin, we’ve seen that demand can be created even without a physical product—will TSLA follow the same psychology? Let’s watch how price reacts! 🚀📊
#Tesla #StockMarket #CandlestickPatterns #Trading #BullishOrBearish

Tesla rebounds after 55% grash, can it keep climbing?Tesla stock is bouncing back after a rough start to 2025. Following 58 days of sideways trading, a breakout has triggered a 27% move. What is next and is too late to trade?
This content is not directed to residents of the EU or UK. Any opinions, news, research, analyses, prices or other information contained on this website is provided as general market commentary and does not constitute investment advice. ThinkMarkets will not accept liability for any loss or damage including, without limitation, to any loss of profit which may arise directly or indirectly from use of or reliance on such information.

$TSLA approaching a good area for shortAs tesla approaches the 50% mark of 4hr structure look to take shorts. 1st target can be 327ish depending on candle closes we might be able to take lower to 310 then maybe 300.

TESLA LOOKS REALLY GOOD FOR THE NEXT 3 YEARS FROM HEREIn this video, I talk about how the next 2 to 3 years look super bright for Tesla stock's future, and even how the next 6 to 12 months could play out

