Tesla May fall before it revives.We are in the middle of a demand area for Tesla. What does that mean? With the heavy selling, tons of demand is being fulfulled. We are getting close to the bottom of where there is strong demand (210-212). If We do not close below this area, there is a strong case for a rebound up to the 255 area. This may happen quickly.
With this "Players" Strategy, Participants, or "players" are able to be found out through pure price action and volume. Follow for more charting and happy trading!
TSLAD trade ideas

Tesla ShortI have analyzed Tesla based on the trend, Candle patter & Gann level. And i can see it will come down now. It was good bounce back from the low. Target is shared. It is in down trend. Stop loss 245.

TSLA 2 MoonTesla, Inc. is an American multinational automotive and clean energy company. Headquartered in Austin, Texas, it designs, manufactures and sells battery electric vehicles, stationary battery energy storage devices from home to grid-scale, solar panels and solar shingles, and related products and services.
MORE BAD NEWS OR NO?Since the Robotaxi event on October 11th, Tesla is up 38% , currently priced at $292 per share This is a return to the early November 2024 price level. But following the market correction over the last month, TSLA shares are down 23%.
This was somewhat expected, given that the Trump-Musk alliance boosted TSLA stock in the short-term, which now fizzled out. The political exposure is also a double-edged sword, which ends up impacting Tesla EV sales.
With protest going up on Elon musk we may see it go down a little ... and investors may view TESLA stock as highly speculative. However if 330 breaks we may see it rise up from there..

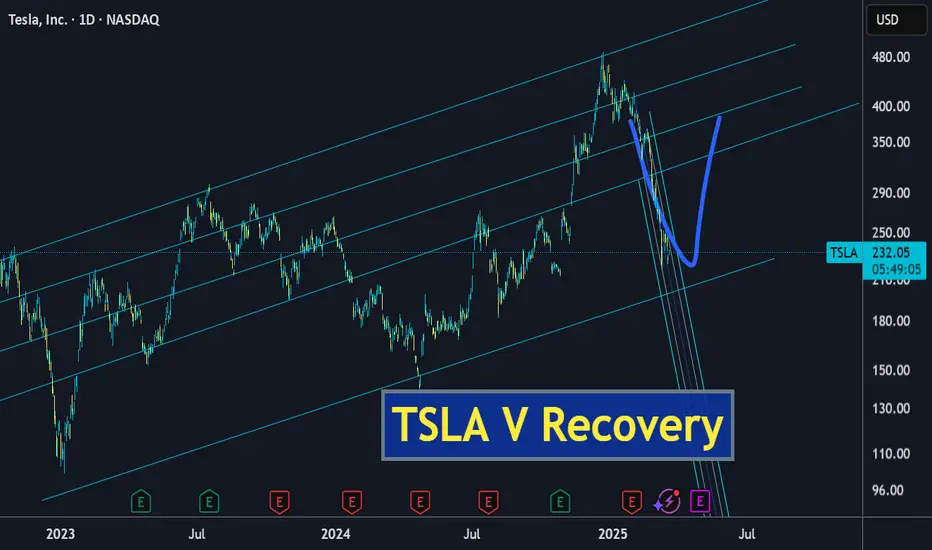
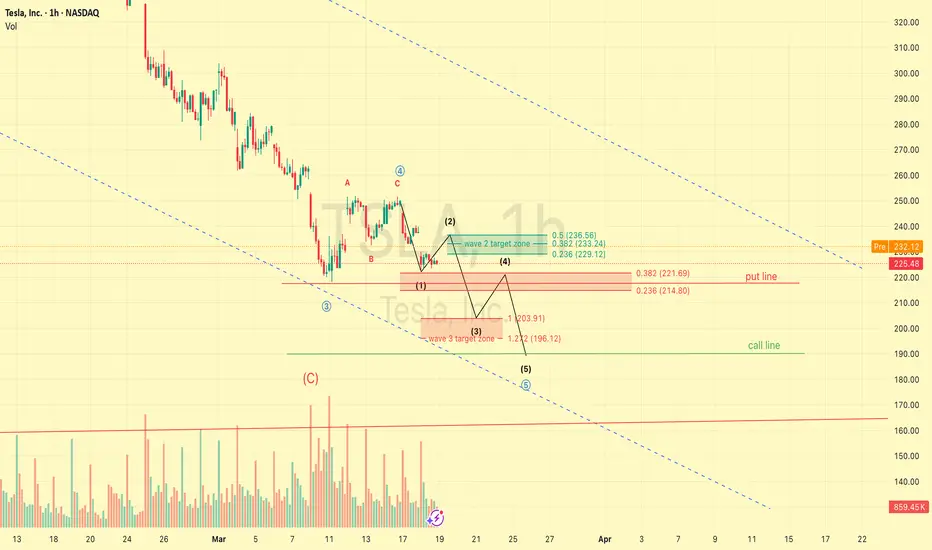
Huge Tesla bottom setup, 500 end of the year(i hope)Elliott wave+ fib analysis. i do see currently we are experiencing the forming of the last bottom(3 more waves to go). NASDAQ:TSLA
Tesla (TSLA) Shares Among the Biggest Losers AgainTesla (TSLA) Shares Among the Biggest Losers Again
As the chart shows, Tesla (TSLA) shares opened yesterday’s trading session with a bearish gap and closed more than 5% lower than the previous day’s close. Meanwhile, the S&P 500 index (US SPX 500 mini on FXOpen) also declined, but by only around 1%.
Why Tesla (TSLA) Shares Fell
The recent two-day decline may be part of a broader downtrend. As we noted earlier in March, one of the key bearish factors could be Elon Musk’s political involvement in the Trump administration. For investors, this may imply that:
→ A significant number of potential Tesla customers may be put off by Musk’s political stance, slowing sales.
→ The CEO may not be paying enough attention to the company at a time of intense competition. Notably, Chinese EV manufacturer BYD Co. (CN:002594) has announced the launch of its Super e-Platform, which can charge a vehicle with a 400-kilometre range in just five minutes.
This sentiment is reflected in analysts’ decisions, as they continue to lower their target prices for TSLA shares, further fuelling negative sentiment.
TSLA Price Forecast
According to MarketWatch, RBC Capital Markets has cut Tesla’s target price from $440 to $320 due to a worsening outlook for the company’s robotaxi programme and autonomous driving software.
However, RBC analyst Tom Narayan maintained a “Buy” rating on Tesla (TSLA) shares, stating that concerns over a sharp sales drop in Europe and China are “overblown.”
Technical Analysis of Tesla (TSLA) Chart
The previously identified downward channel (marked in red) remains relevant. However, price action suggests that selling pressure may be easing:
→ The decline on 10 March (marked by arrow One) was much more aggressive, but the downward momentum has since slowed (also marked by arrow One).
→ During yesterday’s session, the price closed only slightly below the opening level, suggesting that bears are hesitating near the yearly low.
This could potentially lead to a bullish Double Bottom pattern, increasing the likelihood of an attempt to break above the current resistance around the psychological level of $250.
This article represents the opinion of the Companies operating under the FXOpen brand only. It is not to be construed as an offer, solicitation, or recommendation with respect to products and services provided by the Companies operating under the FXOpen brand, nor is it to be considered financial advice.

Tesla What Next? TSLA Buy Bargain OR Bust?✅️Now you guys know my thoughts on this and although TESLA has been beaten ⚫️black⚫️ and 🔵blue🔵 recently somehow there may be an opportunity on the horizon.🚀
ℹ️ The way I look at it is unless you think TSLA is dead forever and to be cast to the dustbin 🟢SeekingPips🟢 would be looking for a buying opportunity.
👌I don't know who coined the phrase first however it's one that 🟢SeekingPips🟢 loves and uses often it's
⭐️"BUY WHEN THERES BLOOD IN THE STREETS"⭐️
⚠️Now don't get me wrong it doesn't mean I will be loading up gun ho RIGHT AT THIS MOMENT but it certainly DOES MEAN I'M NOT A SELLER AND STALKING BUYING OPPORTUNITIES✅️
❓️What's you thoughts on Tesla❓️
Share your thoughts with 🟢SeekingPips🟢
Can it drives 208 miles Or 168 miles ?I am seeing strong support at 208 area. If weekly candle closes below 208, I can see a very good support @166

TSLA Downside targetK.I.S.S. Easy technical target below. Fundamentally overvalued and HATED by the public this brand is going down. I'd be surprised if it doesn't hit the target. Into 2026, I'd not be surprised to see it sink further as people swear off of anything Elon in Europe and Chinese automakers eat its lunch in Asia. Good luck. NASDAQ:TSLA
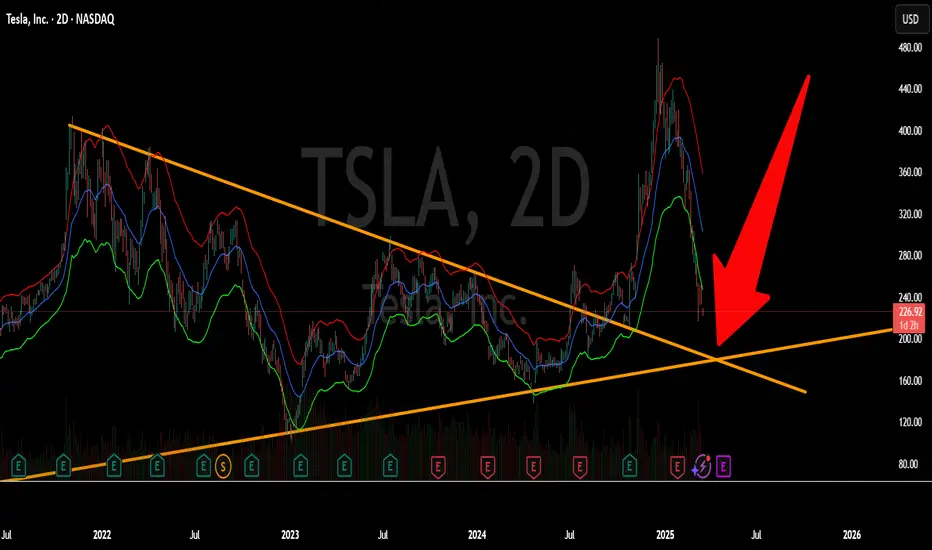
Time to buy TESLA stocks? $TSLA March came with a lot of bloodbath for the US stock market, among these sea of red was Tesla NASDAQ:TSLA ; but it seems the giant American EV company might be gearing for a massive move upwards as it nears its buying zone.
What do you think?

TSLA: Sell ideaSell idea on TSLA because as you can see on the chart we have the breakout with force the vwap and the support line by the sellers.

TSLA dragging the market and vice versa.The decline
The headlines and the chart shows a 50% decline in the value of Tesla shares. Several factors have contributed to this.
According to the company's reports the sales have declined in several regions, on one side, the hype of the electrical brand has diminished and the involvement of Elon Musk in politics has people left wandering who is in charge of Tesla right now? The man who forced people to "work at the office or get fired" is the first one not showing up at the office and taking care of a different business, called politics. His controversial comments, behavior, being under the spot light and the cameras that amplify everything he says and does hasn't created a good image associated with the brand which has sparked the boycotts. The recent show room improvised at the white house didn't help much either. The brand is already associated with politics, and politics by nature are divisive and have contrasting emotions associated. So Tesla became a far right luxurious item, no longer the "Electric Auto for the Masses".
Tariffs and World Politics
The Tariffs and geopolitical instability have taken a toll in the overall market, the investors are nervous and they started taking the exit. Once the index goes down and the Magnificent 7 goes down, they drag the index down. So it's both, Tesla dragged the index and the index is dragging Tesla. NVDA didn't took well tariffs and the main contributors of the Mag7 are dragging everyone down.
Analyst Ratings
Several analysts have reduced the price target for Tesla, so we're not thinking about a new all time highs soon. This is what Trump called "A little disturbance".
The Mag7 Performance
We can see from the chart the performance of the mag7. The main contributors in a hypothetical portfolio have been NVDA, MSFT and TSLA. Tesla started a relative decline compared with the SP:SPX at the end of 2024. Once Elon started getting more involved in politics and less involved with the brand. Afterwards it's been all down hill.
What's next?
We have a systemic risk here, the secular bull market is currently in correction, and if the current politics plus the performance of the main components of the Index aren't strong enough to hold the correction, then we'll see a recession and a sharp decline in the market. Elon Musk is damaging the brand, he's the main shareholder, and he should take accountability of his actions and how they are hurting the company. He should step down and let someone else take care of Tesla. His public image is no longer what sparked the interest in Tesla. His multitasking CEO commitments and now his "Head of DOGE" position, aren't helping Tesla at all.
Removing Elon won't create a reversal in the trend, but at least this will give Tesla better credibility in the market and dissociate it with the political world.

Grafic TSLA ComparativThis TradingView chart illustrates the relative performance of several major assets—TSLA (Tesla), AAPL (Apple), GOOG (Alphabet), BTCUSD (Bitcoin), GM (General Motors), DELL, and others—over a 4-hour timeframe on the daily chart, spanning late 2024 to March 17, 2025. The period captures the market's reaction to Donald Trump’s re-election and early policy implementations, including tariffs and a push for a weaker dollar. Tesla (yellow line) and Bitcoin (purple line) saw significant gains in late 2024, reflecting optimism in innovative sectors, but both experienced downturns in 2025, with Tesla down 5.41% and Bitcoin up 22.18%. Traditional players like Apple (red line, -4.19%), Alphabet (blue line, -2.00%), GM (green line, -8.76%), and Dell (orange line, -26.36%) have generally trended downward, highlighting the broader impact of macroeconomic pressures such as rising inflation, global trade tensions, and policy-driven market volatility. The chart underscores how macro conditions and political decisions can overshadow individual company performance, driving relative stock movements in a turbulent economic landscape.

TESLA stock Chart Fibonacci Analysis 031725Trading Idea
1) Find a FIBO slingshot
2) Check FIBO 61.80% level
3) Entry Point > 241/161.80%
Chart time frame: D
A) 15 min(1W-3M)
B) 1 hr(3M-6M)
C) 4 hr(6M-1year)
D) 1 day(1-3years)
Stock progress: C
A) Keep rising over 61.80% resistance
B) 61.80% resistance
C) 61.80% support
D) Hit the bottom
E) Hit the top
Stocks rise as they rise from support and fall from resistance. Our goal is to find a low support point and enter. It can be referred to as buying at the pullback point. The pullback point can be found with a Fibonacci extension of 61.80%. This is a step to find entry level. 1) Find a triangle (Fibonacci Speed Fan Line) that connects the high (resistance) and low (support) points of the stock in progress, where it is continuously expressed as a Slingshot, 2) and create a Fibonacci extension level for the first rising wave from the start point of slingshot pattern.
When the current price goes over 61.80% level , that can be a good entry point, especially if the SMA 100 and 200 curves are gathered together at 61.80%, it is a very good entry point.
As a great help, tradingview provides these Fibonacci speed fan lines and extension levels with ease. So if you use the Fibonacci fan line, the extension level, and the SMA 100/200 curve well, you can find an entry point for the stock market. At least you have to enter at this low point to avoid trading failure, and if you are skilled at entering this low point, with fibonacci6180 technique, your reading skill to chart will be greatly improved.
If you want to do day trading, please set the time frame to 5 minutes or 15 minutes, and you will see many of the low point of rising stocks.
If want to prefer long term range trading, you can set the time frame to 1 hr or 1 day.

TSLA, a break coming. But not over yet… Tesla looks like it’s about to take a break from its vicious pounding in the market, potentially returning to $270. But it looks inevitable that NASDAQ:TSLA is going to come across some very serious trend lines soon, joining at approx $170 end of April, right at the earnings date….

TSLA in Buy ZoneMy trading plan is very simple.
I buy or sell when at three of these events happen:
* Price tags the top or bottom of parallel channel zones
* Money flow spikes beyond it's Bollinger Bands
* Stochastic Momentum Index (SMI) at near oversold overbought level
* Price at Fibonacci levels
So...
Here's why I'm picking this symbol to do the thing.
Price in buying zone at bottom of channels
Stochastic Momentum Index (SMI) near oversold level
Money flow momentum is spiked negative and under at bottom of Bollinger Band
Price at or near Fibonacci level
Entry at $100
Target is upper channel around $340
the last time this condition was met, NASDAQ:TSLA went up 10%, so let's see what happens.

TSLA March 2025Trade idea based on March options expiration.
Volatility expected.
Apply low risk, TA points on 179 touch and quick reverse.
Not a trading idea... and so on.

TSLA - ALL CLEAR AGAIN Small update on continuing idea. TSLA seems to have held in there and the rally that had started, and I thought was going to fail, has grown some legs. Getting back in $246 - $243 is ideal for at least a leg to $275 - $295, and maybe $310. Will update.

xLong TSLA: Navigating Volatility for Short-term Gains
- Key Insights: Tesla's recent volatility creates potential for gains,
especially if it can push above the $250 resistance level. Positive
sentiment on Tesla's technological advancements, particularly in AI and
autonomous driving, is a crucial factor that could drive up investor
interest and stock recovery. The broader tech sector's resurgence looks
promising, with Tesla remaining a key player alongside Nvidia. Yet,
geopolitical dynamics and high-profile relationships could sway market
sentiment.
- Price Targets: For a long position:
- Next week target 1 (T1): 258.99
- Next week target 2 (T2): 264
- Stop level 1 (S1): 225.73
- Stop level 2 (S2): 222.01
- Recent Performance: Tesla's stock is experiencing considerable bearish
momentum, currently trading below key moving averages. Despite this slump, a
recovery is plausible if it surpasses significant technical levels like
$250, potentially realizing short-term gains.
- Expert Analysis: Analysts are divided, though many see promise in Tesla's
focus on AI and autonomous driving technology as pathways to future growth.
Skepticism remains regarding brand sentiment, yet some view current dips as
buying opportunities. The one-year outlook suggests potential recovery,
aided by bullish market sentiment towards the tech sector.
- News Impact: Noteworthy developments include Tesla's strides in autonomous
driving tech, garnering market attention and possibly altering investor
sentiment. External factors such as the US-China geopolitical situation and
legal controversies pose risks but also shine light on Tesla's innovative
capacity. Product launches, like the Model Y in China and the AI-driven
Optimus humanoid robot, promise to enhance market stature, influencing
demand and brand clout. Tesla's market narrative continues to be rich with
challenges and opportunities, crucial for investors to assess diligently.

How to Draw Trendlines Like a Pro – Rulers Out, Rules In!Hi everyone!
If you don’t have any rules for drawing a trendline, then this is by far the most subjective technical analysis criterion of all. So, grab your ruler, and let’s dive in! ;)
Without clear guidelines, you can draw it however you want, shaping the narrative to fit your bias. This makes it the perfect tool to talk yourself into a trade or justify staying in a bad one—there’s always a new “support” coming…
If you don't have rules, you can always find some dots to connect, making it look "perfect" for you.
In this post, I'll discuss buying opportunities using trendlines, share key rules for drawing them correctly, and highlight common mistakes to avoid - all with a focus on mid- and long-term investment opportunities.
-------------------------
The Basics: How to Draw a Trendline
The trendline is a highly effective tool for mid- and long-term investors to find an optimal buying zone for their chosen asset. I always take a full view of the chart, analyzing its entire history to find the longest trendline available. The longer the trendline, the stronger it is!
To draw a trendline, we simply connect two points and wait for the third touch to confirm it. Easy, right?
The strongest trendline comes from points that are easily recognizable—you should spot them in a split second.
Maximum view, if possible Monthly chart, connect the dots and wait for a third one.
For me, the third and fourth touches are the most reliable.
If you have to look deeply to find where to draw a trendline, then it's already a first sign that it’s not strong! The best ones appear instantly.
---------------------------
Two Myths About Trendlines
Myth #1: "You cannot draw a trendline without three touching points."
Don’t even remember from where I heard that kind of bs but as you see in the images above, yeah I can. If I have a correct lineup, the third touch is the strongest.
Myth #2: "The more touches, the stronger the trendline."
Yes, a trend appears stronger with more touches, but each additional touch increases the odds of a break or trend change. To buy from, let’s say, the sixth touch, there must be strong confluence factors, and fundamentals should support the investment.
“The trend is your friend, until the end when it bends.” — Ed Seykota
Sure, I’ve had great trades from the fifth or seventh touch, but as said, the area has to be strong, combining multiple criteria. Think of a trendline like 3-5 cm thick ice on a lake. You can’t break it with one hit, or the second, or the third. But after the fourth or fifth, it starts to crack, and by the sixth—boom!
From my psychological perspective, the more touches, the weaker the trendline becomes.
-----------------------
Rule #1: Wick to Wick or Body to Body
If there aren't any anomalies, the trendline should always be drawn from wick to wick (image below) or body to body.
Here was the trendline draw from wick to wick
I mostly use body-to-body when there is a lot of noise on the chart and many large wicks that don’t show the real price behavior—whether from a panic sell-off or other unexpected market moves.
Candlestick chart, the trendline drawn from body-to-body
Tip! Body-to-body means drawing trendlines from closing prices to remove unnecessary noise from the chart. To make the chart even clearer, I often use a line chart (it tracks closing prices), which filters out the noise and gives a cleaner view of the price action.
The same chart as above using line chart.
Mistake to avoid: If you start from the wick but the second point is from the body, it's wrong. This can lead to misleading breakout trades or confusing rejection trades.
If there are no significant large wicks, go from wicks.
If a chart offers a lot of huge panic-sell wicks, use bodies instead to get a cleaner setup.
Quite often, I use a hybrid version as well. We are investors, not traders. We need a price zone, not an exact price!
In these cases, I combine wicks and closing prices to find the optimal trendline, which stays somewhere between them.
Light-blue is the zone
-----------------------
Rule #2: Higher Highs Strengthen the Trendline
A trendline is more reliable if the price makes a new higher high (HH) after the previous rejection, and before it approaches a trendline.
The third and fourth touch came from higher high (HH) levels
This confirms that the recent trend is strong. If it all lines up, we can step in!
-----------------------
Rule #3: Even Timing Between Touches
A trendline rejection works best when the timing between touches is symmetrical. They don’t have to be perfectly equal but they also shouldn’t be wildly different - one touch being very small and another very large can weaken the trendline’s reliability.
A good combinations is when the price comes from higher high levels, the next touch has an equal or fairly similar distance between previous ones.
Yeah, there are quite a lot of touches, but you get the point; market symmetry plays an important role in making decisions.
Warning: If the next touch comes too soon, especially from a lower high (LH) levels, which signals that momentum may be fading, and the touch happens at an uneven distance, it weakens the trendline’s reliability. So, watch out for that.
Two alerts: uneven length between touches & comes from lower highs.
Next red alert: When there are huge uneven gaps between touches, as shown in the picture below.
The first and second touch compared to the second and third touch are out of balance, weakening the trendline's reliability.
------------------------
Trendline Summary: Key Criteria for Mid- to Long-Term Analysis
Open the maximum chart view – analyze all available data for the asset.
The higher the timeframe, the stronger the trendline.
A trendline needs two clean and clear points to be drawn.
The highest probability rejection happens at the third and fourth touch.
If there are large wicks or panic sell-offs, use closing prices (body-to-body).
Remove noise and wicks by using a line chart for a clearer view.
A trendline touch is strongest when the price approaches from a higher high (HH).
A trendline touch is strongest when the distance between touches is symmetrical.
A slight flex in the trendline is ideal; it should be between 20 to 35 degrees, not too steep in its climb. ;)
These are the main criteria for a trendline that I use when analyzing stocks or any asset from a mid-to long-term perspective.
----------------------
Trendlines Alone Are Not Enough
Now, here’s the interesting part. Even if a trendline looks perfect and meets all criteria, I still won’t rush to share an analysis. Why? Because a trendline alone isn’t enough.
A trendline is just one piece of the puzzle. We need multiple confluence factors in a single price zone to make the setup truly strong and reliable. Usually, I need at least 3-7 criteria to align before making a move or recommendation.
So, that's it! A brief overview and hopefully, you found this informative. Feel free to leave a comment with your thoughts!
Before you leave - Like & Boost if you find this useful! 🚀
Trade smart,
Vaido

Will Monday March 17 determine the FUTURE of TSLA?Monday is shaping up to be a crucial day for TSLA. The stock has been consistently testing the $250 level, and a break and hold above this zone could signal a return to an uptrend. If buyers step in and sustain the price above this resistance, we could see further bullish momentum.
However, if TSLA fails to hold above this level, there’s a strong possibility of a drop back to $232, where the next major support lies.
For now, I expect price action to fluctuate between the orange resistance and the blue trendline support. A breakout above or below this range would indicate the next directional move—either an upward continuation or a downward breakdown.
Strategy for Monday:
- If the price goes below the blue supporting line, short with a stop loss above $250.50 line and set profit to the red support at $232.
- If the price goes above the orange line, set a stop loss at around $240 and set profit to $264 ~ $265
Disclaimer: This is my personal trading perspective and not formal investment advice. Always do your own research and manage your risk accordingly.

TSLA Ready to Break Out? Key Levels to Watch! Mar 17Hey traders! Quick check-in on TSLA based on the 4-hour chart.
📈 Technical Analysis (TA):
TSLA broke above a descending trendline signaling potential bullish momentum.
Watch closely for a confirmation above the current supply zone around $250-$255.
We had a clear Change of Character (CHoCh) indicating a possible reversal from the previous downtrend.
Important support sits at the recent demand zone around $215-$217, marked as a Break of Structure (BOS).
Next strong resistance to watch is around $320; breaking this can trigger a big move up.
📊 GEX & Options Insights:
Highest negative NET GEX at $217, strong PUT support here—keep this level marked clearly.
Call resistance is around $255; breaking above here could initiate a gamma squeeze pushing prices higher.
IV Rank is relatively high at 57.8%, signaling premium prices are rich—good for selling premium or credit spreads.
Call to Put ratio shows slight bearish sentiment (33.4% Calls), so keep your risk tight.
💡 Trade Recommendations:
Bullish Play: Wait for a clear close above $255 to enter calls, targeting around $300. Tight stop-loss just below $245.
Bearish Play: If TSLA rejects the $255 resistance strongly, consider puts targeting the demand zone around $217.
Neutral traders might consider Iron Condors or credit spreads between the clear ranges ($215–$255).
🛑 Risk Management:
Always use defined risk strategies, particularly with the higher IV environment we're in.
Let's see how it plays out. Good luck!
Disclaimer: This analysis is for educational purposes only and does not constitute financial advice. Always do your own research and manage your risk before trading.

TSLA Breakout Retest: What Could Signal Bullish Surge NASDAQ:TSLA Breakout Retest: What Could Signal Bullish Surge – Is Tesla poised for a major move? In this video, I break down the breakout retest pattern on TSLA’s weekly chart, focusing on the critical near term levels. A validated breakout could hint at a higher time frame bullish scenario! I’ll cover:
Rules to validate or invalidate the pattern
Conservative and aggressive price targets
My personal targets based on years of trading experience
Don’t miss this Tesla stock analysis for 2025!
What to Watch For:
Breakout confirmation at $490
Stop-loss zones and risk management
Potential bullish surge targets
