TSLA Rebounds from $290 | Buy the Dip or Political Trap?⚠️Just when it looked like Tesla was heading for a breakdown, we got a sharp bounce off the $290 level — and traders are watching closely. But here’s the twist: the move came after a headline-heavy week featuring none other than Trump vs. Elon.
🗞️ According to Politico, tensions flared after Trump made comments suggesting EVs were "doomed without government subsidies." Elon clapped back, defending Tesla’s profitability and independence. This added pressure on TSLA... and then came the bounce. Coincidence? Or whales buying fear?
📥 Entry Zones
• $290 – Strong demand zone, tested and respected
• $275 – Deeper retest if market pulls back
• $240 – Extreme fear level, unlikely unless macro worsens
🎯 Profit Targets
• $305 – Gap-fill magnet
• $320 – Resistance test
• $355+ – If Robotaxi or AI hype returns in force
TSLAD trade ideas

LONG entry @ $316.05 | 09:55am + LONG exit @ $321.05 | 11:20amToday goes to show what happens when you follow structure, and let mat and probability take care of the outcome. An exceptional day, remember... consistent green days are a reflection of discipline, not luck.
Some more pertinent details re price action today. I hit an algo entry at 9:55, MM's did a hard shake out of the weak hands, dropped the price significantly but there was no strong bearish FVG even though price dropped 3 points which gave me conviction to hold the position which paid off very well. There was no significant short move and the price rallied to a weekly high.
Polyanonymous.

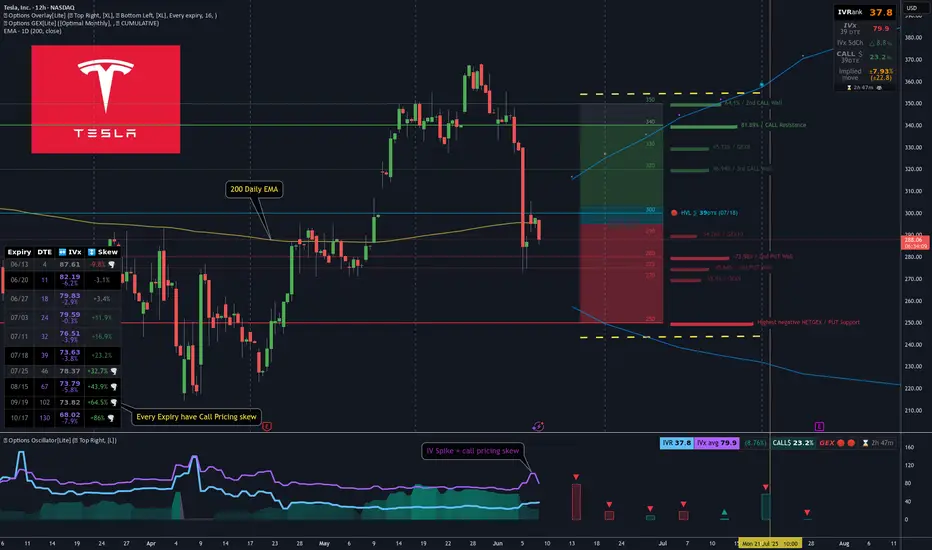
[GEX] TSLA Breakdown & Options Trade Idea for 39DTELast week, TSLA dropped hard, likely due to political tensions. Let’s not forget — just a month ago, their EVs were showcased at the White House entrance...
In the span of 30 hours, TSLA fell -22% (see red line below), while SPX barely reacted. Why? Because both realized and implied volatility dropped — remember VIX is around 17/18.
This sharp TSLA drop already seemed overdone, which helped fuel the +5% bounce on Friday.Most TSLA options positions are near-term and still show negative sentiment — but further expirations grow increasingly bullish.
🔍 If you use options GEX matrix , you’ll see the bearish hedging flow gradually turns more neutral-to-bullish.
Most cumulative support/resistance zones lie between 250–340, with spot currently just under the chop zone.
🧠 TSLA Trade Idea
It’s been a while since I posted a neutral Iron Condor, but TSLA might be an exception.
Despite last week’s IV spike, call pricing skew still dominates across expirations — as seen in our Options Overlay indicator.This tells me the market doesn’t fear TSLA crashing below 200. So, I’m aiming to capture premium on the July 18th expiry without day trading.
I’m thinking of something simple, well-manageable in either direction.To refine leg placement, I use visual GEX zones.
🐻🔴 Downside:
Strong put support at 250
Gradual support layers up to 280
🐂 🟢 Upside:
Target area: 340–350 for the July 18 expiry.
📅 Closing the Trade:I'll consider closing or adjusting at 21 DTE or when 50% max profit is hit — per TastyTrade’s studies.
🔁 Rolling Plan:IF short delta on one side drops below ~14 and price pulls away, I’ll roll the untested side to collect more credit.
🧑🏫 I’ll likely post trade management live in Discord for educational purposes.
~~~~~~~~~~~~~~~~~~~~~~~~~~~~~~~~~~~
🦋 Bonus Idea: TSLA Broken Wing Butterfly
If you think TSLA has more downside, a Put Broken Wing Butterfly — like the one shown in my previous YT video — is also a great way to structure this trade using the same GEX levels.
There’s no single way to use Gamma Exposure — it’s the most actionable hedging signal we have. Combine it with your knowledge of strategies and you can trade almost any scenario.
One thing’s for sure — this market moves faster than ever.A single day of internal conflict wiped -22% off TSLA…The next morning, the market already moved on, so as always:
Trade Safe Out There!
$TSLA is making moves! 30% Upside Swing🚀 NASDAQ:TSLA is making moves!
The H5_S is almost there—just waiting for that green light 🟢 to lock in the entry!
🔥 Eyeing July 18th $325 Calls if we get the confirmation. Let’s see how this unfolds!
Not Financial Advice

TSLA. SHORT @ 304. SHORT @ 295. LONG @ 284. LONG @ 273. INTRADAYOverview -
The economic calendar is light this week. The stocks previously have shown a trend of being affected a lot more by the news, compared to the economic data. Today, US-China are having talks regarding the trade. The volatility should come from the outcome of the trade discussion. We will not stay in the market for that long. We will only trade the predictable open and call it day.
INTRADAY PLAN -
1. If the stock rallies to 295 area and we see selling pressure. We instantly short the stock till 284. We take a partial out at 284, then observe the price action behavior. We can either sell rest of the position or, trail the stop loss to 273.
2. If the stock consolidates at the open, at 290. We wait for confirmation of selling strength and go short till 285 area. We sell all our position there.
3. If the stock drops to 284 right at the open, we wait to see which side is stronger. If the sellers are strong, we go short till 273. But if we buyers are strong we wait and do nothing. We let the price run higher and then come back. If buyers really are strong, then we should start seeing strength at 285-286 area or higher. Then we can go long.

TSLA. LONG @ 309. SHORT @ 330. PIVOT @ 318. INTRADAY 1. If stock doesn't break the 312 level in the pre-market and ends up rallying to 318, where we see a little selling strength. We wait. We let the price come down and wait for the buyers to make the following moves.
If the buyers step in at 316+, we go long till 341.
If the buyers step in at 309+, we go long till 330.
2. If the stock blows past 318 and directly rallies to the 330 area, we wait for the sellers to show themselves. If the sellers starting showing desperation in the 330 area, we go short, till 318.
3. If the stock opens, 309 support fails and the stock directly drops to the 300 zone. We wait for a good entry at 309 zone and go short from there till 295.

Yesterday was a great time to buy the dip!I see a lot of money coming in at higher time frames. I will hold for a while, and I also see lots of turbulence. Let’s see what happens after the CPI on June 12 😎

TSLA: $300 is an important numberOver the past 5 years, $300 has been a very important price point -- both in support and resistance. Only once have we converged with the 200 day at $300 mark, and that was when we were hitting it as resistance. We are now in a position to do the same from the position of support. I think a similar yet opposite pattern should unfold if we move to this range.
Outside all that, we continue to maintain a cup and handle pattern. We are also maintaining higher lows.
Bullish signals and patterns outweigh the bearish in my eyes.
Best of luck.

Of course the target is 420New range. Momentum is in. Bull market back on.
Just following target's not trading advise.

The Trump & Musk Friends Again - Tesla RippingAnalysts attribute the recovery to cooling tensions between Elon Musk and President Donald Trump, which had previously weighed on investor sentiment.
Additionally, Tesla's upcoming robo-taxi launch on June 12 is generating excitement, with some analysts predicting it could be a major revenue driver. However, concerns remain about Tesla's valuation, as it trades at a price-to-earnings ratio of 192, significantly higher than traditional automakers.

Tesla's Bullish Momentum Points Towards $312 Target
Current Price: $295.14
Targets:
- T1 = $304.50
- T2 = $312.90
Stop Levels:
- S1 = $289.00
- S2 = $282.50
**Wisdom of Professional Traders:**
This analysis synthesizes insights from thousands of professional traders and market experts, leveraging collective intelligence to identify high-probability trade setups. The wisdom of crowds principle suggests that aggregated market perspectives from experienced professionals often outperform individual forecasts, reducing cognitive biases and highlighting consensus opportunities in Tesla.
**Key Insights:**
Tesla continues to demonstrate strong fundamentals backed by innovation in electric vehicles (EV) and sustainable energy solutions. Recent advancements in battery technology, coupled with expansion plans in international markets, are expected to drive significant growth over the next quarter. Technically, the stock shows consistent support levels formed during consolidation phases, suggesting a low-risk entry point for a bullish position. Market momentum indicators signal improving buyer strength, reinforcing the outlook for a continued rally.
**Recent Performance:**
Tesla's stock has shown resilience in the face of broader market volatility. Over the past two weeks, Tesla has moved within a tight range, suggesting accumulation by institutional investors. The recent stabilization around $290-$295 indicates that previous resistance levels have now turned into support, paving the way for further price movement towards higher targets.
**Expert Analysis:**
Analysts at major investment firms have reiterated confidence in Tesla's capacity to maintain its leadership in the EV market. Factors such as improved gross margins, strong quarterly delivery numbers, and strategic partnerships contribute to an optimistic outlook. From a technical standpoint, the stock's moving averages show bullish alignment, indicating sustained upward momentum. Volume analysis portrays strong buying activity, further validating bullish momentum.
**News Impact:**
Positive sentiment has surged following Tesla's announcement of doubling production capacity at its key Gigafactories, including its Nevada facility. Additionally, international regulatory approvals for Tesla's next-generation vehicles have fostered enthusiasm among investors. Broader sector movements, supported by potential shifts in Federal Reserve policy, also boost Tesla's trading outlook.
**Trading Recommendation:**
Tesla offers an attractive long setup for traders looking to capitalize on both fundamental and technical strength. A bullish position at current levels aligns with professional trading insights, with reasonable targets set at $304.50 and $312.90. Recommended stop levels are placed at $289 (S1) and $282.50 (S2), ensuring risk management while allowing room for volatility. With favorable macroeconomic factors improving the environment for growth stocks, Tesla remains a strong candidate for upside potential in the short-term.

Bulls FailedThe bulls seem to have not the power to bring the stock back up and to close the window of June 5th. The support zone seems to halt.
It is a very strong one lasting since March.

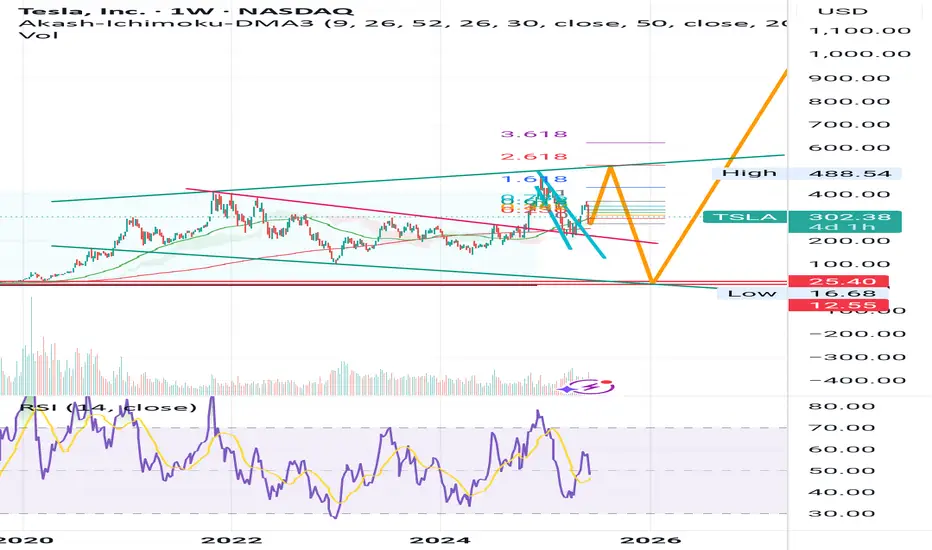
Tesla - There's more after the +60% rally!Tesla - NASDAQ:TSLA - will blow even further:
(click chart above to see the in depth analysis👆🏻)
It is almost incredible to see such a large cap stock rally more than +60% in less than two months. But Tesla is clearly the exception and therefore we should expect the unexpected. What's quite likely is at least another rally of about 25% from here and a retest of the previous all time high.
Levels to watch: $250, $400
Keep your long term vision!
Philip (BasicTrading)

TSLA road to $526... to $10... to da mooo00nHaters gonna hate, but these patterns need to complete, nevermind most of the holders bought in at 10 usd, and that's where the support is.
Not financial advice, not funancial either badum tss
Tesla - Short Term Chart, Bullish BreakoutTesla is surging after a significant pullback. Could this be a turning point? I'm optimistic about Tesla's long-term potential and have been holding for the long haul, anticipating new highs in the future.

The pullback may be over soonI believe we’re approaching a bottom in this correction. I’m expecting a double bottom or a dip below it followed by a rebound.

Todays Entry @ $288.45 @ 09:35am | Exit @ $293.03Pre Trade Prep:
EMOTIONAL STATE = 8
TIREDNESS = 7
Execute your edge with robot like consistency, let me the math win for you over the long term.
A surgeon doesn't not operate because his last patient died.
The battle is won before the opening bell rings.
Visualise winning and losing scenarios.
--------
1) Am i physically and mentally ready to trade?
2) Do I have clear plans for todays trades.
3) Am i prepared to walk away if there is no set up?
-------
Today, I will only trade what the system confirms.
Today, I will accept losses with composure.
Today, I will protect my emotional capital.

Support ZoneWe have reached anmimportant support zone reaching from 27th April till May 8th. I think that we shall stop here and gom for an upward retracement.

Safe Entry ZoneCurrent Movement is Down.
The Green 4h Zone @ 277-271 price level is strongest support level price targeting.
Note: 1- Potentional of Strong Buying Zone:
We have two scenarios must happen at The Mentioned Zone:
Scenarios One: strong buying volume with reversal Candle.
Scenarios Two: Fake Break-Out of The Buying Zone.
Both indicate buyers stepping in strongly. NEVER Join in unless one showed up.
2- How to Buy Stock:
On 15M TF when Marubozu Candle show up which indicate strong buyers stepping-in.
Buy on 0.5 Fibo Level of the Marubozu Candle, because price will always and always re-test the imbalance.

Important support and resistance sections: 267.07-311.48
Hello, traders.
If you "Follow", you can always get new information quickly.
Have a nice day today.
-------------------------------------
(TSLA 1D chart)
If you see support within the important support and resistance sections, it is a time to buy.
However, if a strong decline occurs, strong buying is expected around 172.6-234.59.
It is expected to be an important buying period for long-term investment.
-
Thank you for reading to the end.
I hope you have a successful transaction.
--------------------------------------------------

TSLA – Are You Buying Cheap or Buying Expensive?Tesla (TSLA) continues to trade within a long-standing macro range, well-defined by two behavioral zones:
🟩 Value Zone – Accumulation ($132 to $270.50):
This is where smart money tends to accumulate over time. Historically, moves from this zone lead to long-term rallies. Price spent multiple weeks here during major drawdowns — offering long-term entries at discounted value.
🟥 Premium Zone – Profit Taking ($270.50 to $409):
Above the midpoint ($270.50), price enters what can be considered the “expensive” territory. Historically, this area has acted as a supply zone, with frequent distribution and sharp reversals.
TSLA is currently sitting just above the midpoint, testing that equilibrium. Whether it consolidates for another leg higher or fails here could define the next swing move.
So ask yourself:
Are you buying value, or chasing premium?

TESLA SHORT?Are we win for a surprise with tension between Trump and Musk intensifies, with recent comments from President Trump regarding Tesla, we could be in for a bearish probability towards 100 key price level.

Nothing to Be Afraif Of!- Tesla has historically traded at high valuation multiples—and still does. But since its investor base is driven by excitement for the future and a love for innovation, it's unclear how much those valuation metrics really matter.
- After the first higher low structure following a corrective price wave, Tesla surged as much as 227.60%, before facing selling pressure. We're now tracking the second impulsive wave's retracement, particularly the 61.8% and 78.6% Fibonacci levels.
- Trying to catch the bottom at these levels is pointless. It's better to wait for 2–3 green Heikin Ashi candles and confirmation that these levels are holding.
- Current positions can be held. If you want to sell, go ahead—but remember this: No one has stayed optimistic about Tesla for more than two months. So, there's no need to panic.
