UBER be ready to buy Uber at four hours
As part of the formation of the falling wedge pattern, which is a positive model
We note that the high trading volumes at the bottoms (there is a buyer at the bottoms only)
We also note the "positive deviation of prices with the MACD
The closing is above the (decreasing) resistance 40.00 buy for a target 44.93
UBER trade ideas

A good level for buying UBERThe price of UBER is now at the level of the former resistance, which now acts as support (mirror level).
In addition, the price is also at the 1.618 expansion level from the first wave of the downward movement.
The short takeaway, which was formed in the local accumulation, also acts in favor of the purchase.
You can buy with a small stop at 38 (-5%) and a target at 48 ($19.8)

UBER Daily TimeframeSNIPER STRATEGY
This magical strategy works like a clock on almost any charts
Although I have to say it can’t predict pullbacks, so I do not suggest this strategy for leverage trading.
It will not give you the whole wave like any other strategy out there but it will give you huge part of the wave.
The best timeframe for this strategy is Daily, Weekly and Monthly however it can work any timeframe above three minutes.
Start believing in this strategy because it will reward believers with huge profit.
There is a lot more about this strategy.
It can predict and also it can give you almost exact buy or sell time on the spot.
I am developing it even more so stay tuned and start to follow me for more signals and forecasts.

$UBER Bears looking for a ride Lower 👇
Hopefully you find the chart helpful in terms of Supports & Resistance etc.
we refrain from adding commentary on the chart as that is reserved for our members and we are very conscious of not giving financial or trading advice.
Thank you for taking time to consult our chart and we would really appreciate a like, follow or comment.

UBER - TRADE PLANHi Traderchamp here,
Thanks for visiting. Appreciate if you hit the thumbs up right below and leave your suggestions and feedback. Jump into my Tradingview page to find other charts which I have worked on. Thank you!

uber longUber is at the year support area based on volume profile . i plan on buy a couple long term out of the money call options to let this play have room move. In Tipranks the price target is 68. with a smart score of 8.

UBER - Daily - Bounce point or hitting Buy point 2?2 buy points will UBER bounce? Already having RSI contradiction

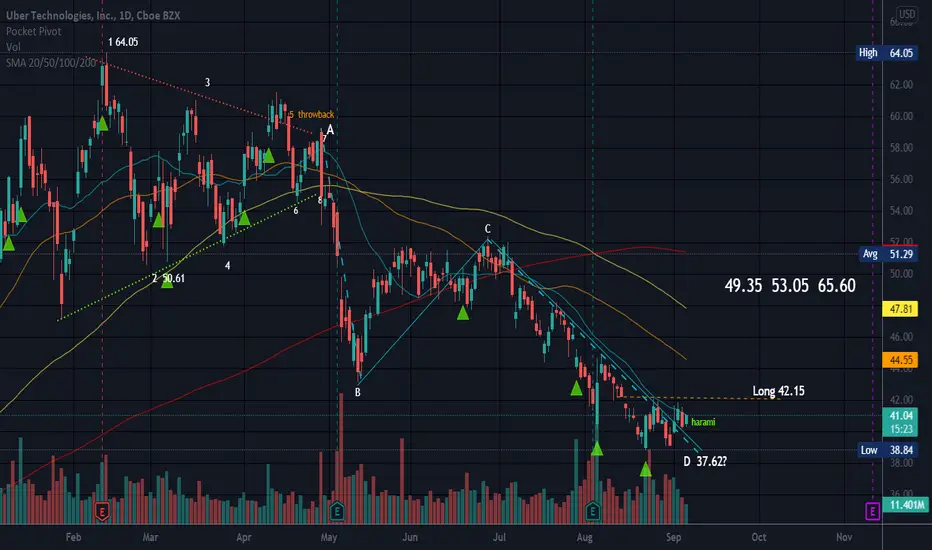
AB=CDUBER may or may not have found a bottom for now but the AB leg does equal the CD leg at the most recent low. Resistance overhead.
If you spot this pattern, you can use the magnet to move the AB leg and project it down from C. This pattern is not always the exact length of the AB leg though and can be an extension of that leg (making price go lower than the length of the AB leg) or it can hit the .618 or .786 fib level of the AB leg making the CD leg not quite as long as the AB leg. So far this one is equal.
The blue dashed lines show the AB and the CD legs.
I like it when they are equal (o: Just does not always work out that way! My mental stop in under 37.
ABCD patterns often look bearish , and unlike ABC bullish , which is a pull back/correction pattern, an ABCD pattern has the second valley, or low point, lower than the first B is lower than D). In an ABC bullish pattern , D is the target after price reaches C and C is higher than A in this pattern. In an ABCD pattern , D is the pattern reversal point, or the point of completion, hopefully.
No recommendation
UBER - Buy - PT $60RSI indicator showing that UBER is oversold. We see a reversal to $60 - $63.
For educational purposes only.

UBER - Potential Reversal ZoneCareful not to try and call the bottom here but looks like a potential reversal zone near purple, orange and yellow lines. Can likely be scalped at those levels at least. The longer it holds the current zone the more confident I am in a breakout over the purple level and and green line as confirmation of reversal out of the down channel.


$UBER Bullish DivergenceClosed out last Uber trade with profits. Re entered here as I noticed 11/19 calls sweeping.
Indicators showing bullish divergence and trading well below respected AVWAP.
Looking for a reversal and move back up towards the AVWAP/middle of channel. Run up to earnings also in play with the 11/19
11/19 45C 1.77 avg 21K OI
11/19 47.5C 1.2 avg 4K OI

Short $UBER CMP $39.45Short $UBER CMP $39.45 Downtrend continues. Trading below most of the moving averages

uber looks like its going no where while uber is down Down and looks appealing to buy i don't think its appealing as it looks in fact at this point it can even gap down!


Your $UBER is waiting$UBER at the bottom of the channel with MACD ready to cross, RSI curl, and bullish flow yesterday.
Went long with the $47.5 11/19 Call
Courtesy of @jpgonzalez93

Buy Into Weakness On Uber Technologies (NYSE: $UBER) 🙌🙌🙌Uber Technologies, Inc. develops and operates proprietary technology applications in the United States, Canada, Latin America, Europe, the Middle East, Africa, and the Asia Pacific. It connects consumers with independent providers of ride services for ridesharing services and other forms of transportation services, including public transit, as well as connect riders and other consumers with restaurants, grocers, other stores, and delivery service providers for meal preparation, grocery, and other delivery services. The company operates through four segments: Mobility, Delivery, Freight, and Advanced Technologies Group (ATG) and Other Technology Programs. The Mobility segment provides products that connect consumers with mobility drivers who provide rides in a range of vehicles, such as cars, auto rickshaws, motorbikes, minibuses, or taxis. It also offers Uber for Business, financial partnerships, transit, and vehicle solutions offerings. The Delivery segment allows consumers to search for and discover local restaurants, order a meal, and either pick-up at the restaurant or have the meal delivered, as well as offers grocery and convenience store delivery, and select other goods. The Freight segment connects carriers with shippers on the company's platform and enable carriers upfront, transparent pricing, and the ability to book a shipment. The ATG and Other Technology Programs segment engages in the development and commercialization of autonomous vehicle and ridesharing technologies, as well as Uber Elevate. The company was formerly known as Ubercab, Inc. and changed its name to Uber Technologies, Inc. in February 2011. Uber Technologies, Inc. was founded in 2009 and is headquartered in San Francisco, California.

Uber should bounceSequential is telling me this should bounce. Daily/Weekly time frames are on a 9 and 8 respectively. On a Monthly time frame, we are on a red 4 after a green 9, (1-4 candle correction is normal after green 9).

$uber at a discountlooking for a gap to fill ? heres your chance in life to fill that empty gap in your life. dont use a smelly taxi use a disgruntle uber driver. californians can kick rocks i love this company from mexico to usa,

$UBER Time to short, or is it? California's prop 22 was found unconstitutional by a supreme court judge late last week, news that were sort of expected since the bill already had plenty of discrepancies. Despite the news and what that means for UBER specifically, I am more interested in how this stock has moved since the bill passed.
Pretty noticeable at first glance, despite missing EPS, on November the stock started an impulsive move leaving a gap behind and that it's closing to nowadays price. If we look at it from a bearish point of view, the .618 was strong resistance above which indicated another wave down towards the 1.618. Interestingly enough, the stock is now below March lows' VWAP and it's fast approaching the IPO VWAP. Very important to note that the 8MA is extended from price action, so a bounce in the near term is not out of the question. Now, will it be at the IPO VWAP? Or will it close below, sending it lower towards the gap and the 1.618? One thing is for sure, these two VWAPs will provide all the information we need in order to short efficiently or to prepare for some choppy price action.

$UBER with a Bearish outlook following its earnings #Stocks The PEAD projected a Bearish outlook for $UBER after a Negative over reaction following its earnings release placing the stock in drift C.
If you would like to see the Drift for another stock please message us. Also click on the Like Button if this was useful and follow us or join us.


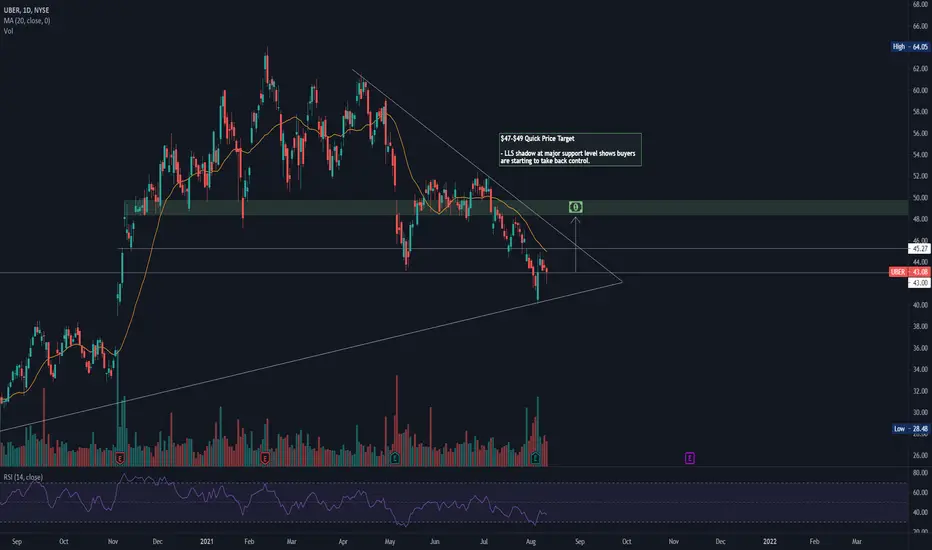
UBER reversal in progressUBER looking prime for a quick run back to the upper $40's. Looking for $47 by 8/20. Playing $46 calls expiring 8/20.