UBER results on quick flips for this ticker--Long @ 82.53 If I ranked the performance of UBER with my algo vs. all the other large caps I trade, it would rank right near the top with regard to return per day held. I don't rank it, because I don't have enough historical data to include it in my rankings.
Its limited results are impressive, however. 196-3 (the 3 are open from the last 3 days) with an average gain of 2.83% and an average hold period of 10 trading days. That's around 7x the daily average return of the market overall.
Additionally, it is currently right at support from the most recent low in early May and the high in February. On a longer scale, it is in a long-term uptrend and only 10 trading days removed from its all-time high. That makes me even more convinced that this is just a normal correction in an uptrend. The pullback has been significant, though, down 9 out of the 10 trading days since that ATH. However, the 5 down days in a row is a solid short term contrarian indicator, historically speaking.
I won't add daily if it keeps falling, in the interests of maintaining portfolio balance and diversification, but I am open to tactically adding to the position. The plan is for a FPC exit, as long as the return is > 0.10% if that FPC comes on day 1 of the trade. Below that, I will hold until a satisfactory exit point is reached.
As always - this is intended as "edutainment" and my perspective on what I am or would be doing, not a recommendation for you to buy or sell. Act accordingly and invest at your own risk. DYOR and only make investments that make good financial sense for you in your current situation.
UBERB trade ideas

Is This the Perfect Moment to Execute the UBER Heist?💰 UBER Stock Market Heist Blueprint 🚀
🌟 Hi! Hola! Ola! Bonjour! Hallo! Marhaba! 🌟
Dear Money Makers & Robbers, 🤑💰💸✈️
Here’s our grand plan: a 🔥Thief Trading Style heist🔥 targeting the UBER stock! Let’s break in with this cunning strategy — chart-ready and primed for action!
🎯 Entry:
The vault’s open! Grab the bullish loot at any price — the heist is live!
Tip: For precision, use a buy limit order on 15m/30m swing highs or lows — that’s your perfect pullback entry!
🛑 Stop Loss:
Thief SL is stashed at the nearest swing low (or just below the MA on the daily chart ~80.00 for swing trades).
Tailor SL to your trade risk, lot size, and your thieving gang’s order plan.
🏴☠️ Target:
100.00 — or vanish before hitting the target to avoid the traps of the overbought zone!
💎 The Setup:
We’re seeing bullishness fueled by key factors: macro moves, fundamentals, sentiment, intermarket trends… it’s all in play! 📈🔗🌏
Check the macro, COT report, sentiment outlook, and future trend targets to stay ahead of the game!
⚠️ Trading Alert:
News releases can flip the game fast.
Avoid fresh trades during major news.
Use trailing stops to lock in those juicy profits and protect your loot.
❤️🔥 Support the Heist Crew!
💥Hit the Boost Button💥 — fuel our robbery plans and let’s keep cashing in every day!
The Thief Trading Style: slick, powerful, and ready for the next heist.
See you soon with another plan, fellow robbers! 🤑🐱👤🤩

Uber Technologies (UBER) – Break & Retest + Long-Term GrowthOverview Summary
Uber Technologies Inc. ( NYSE:UBER ) has approached a structurally significant price zone, both from a technical and fundamental lens. After a strong rally into the $90s, price action has pulled back toward a multi-year resistance-turned-support zone between $81–84. This zone previously capped rallies throughout 2023–2025 and now offers a potential launchpad for a continuation into new all-time highs, especially with the macro backdrop favoring Uber’s platform model.
Technical Insight:
The 4H chart shows a breakout-retest structure, where price is retesting the prior resistance band. This aligns with historical price memory and volume pockets. A successful retest and base in this zone would signal fresh accumulation and set up the next leg toward $100+.
Support Zone: $81.00–85.00
Breakout Target: $100.00
Medium-Term Target: $120
Invalidation Zone: $80
Why We’re Buying Uber: Long-Term Conviction + Technical/Fundamental Confluence
Dominance in Mobility & Delivery: Uber is expanding its lead as the global leader in ride-sharing and food delivery, with strong pricing power and platform scale.
Free Cash Flow Growth: Uber’s recent quarters show consistent positive FCF, with improving margins and reduced reliance on subsidies.
Operating Leverage & Cost Discipline: CEO Dara Khosrowshahi has emphasized discipline, turning Uber into a more predictable, leaner machine.
Uber for Business, Freight, and Ads: These emerging verticals are quietly building into high-margin growth engines, adding new levers to long-term valuation.
AI & Automation Tailwinds: Uber is positioned to integrate AI across logistics, routing, and customer personalization, driving efficiency and margin expansion.
Valuation Reset Opportunity: Compared to high-growth tech peers, Uber trades at a relative discount despite superior revenue growth and execution.
Final Thoughts
We at Green Zone Capital see Uber as a long-term compounder in the platform economy, bridging mobility, logistics, and commerce. Technically, the current pullback may serve as a high-conviction re-entry zone after a multi-month rally. If this zone holds and confirms strength, the upside potential over the next few quarters is significant.

Uber: Topped out Already?Uber sold off sharply after topping out at $94.10 – thus, our short-term alternative scenario needs to be considered. In this view (35% probability), turquoise wave alt.3 has already concluded, and the stock is headed toward a pullback in wave alt.4 . That retracement would likely bottom in the turquoise Target Zone between $65.94 and $57.24 — a potential setup for long entries. The primary scenario remains more bullish: we expect a renewed push above $94.10 to complete the regular turquoise wave 3.
📈 Over 190 precise analyses, clear entry points, and defined Target Zones - that's what we do.

Uber’s Path to $95+Uber Technologies (UBER) is positioning itself for long-term growth by expanding beyond its core ride-hailing and delivery businesses into advertising, travel, service partnerships, and autonomous vehicle (AV) technology. These strategic moves aim to diversify revenue streams and enhance operational efficiency.
Key Growth Drivers:
- Strong Core Business Performance – Uber continues to benefit from robust demand in both ride-hailing and delivery, generating significant economic profit.
- Artificial Intelligence Integration – AI plays a crucial role in optimizing pricing, reducing wait times, personalizing user experiences, and preventing fraud.
- Autonomous Vehicle Expansion – Uber is increasingly leveraging AV technology to reduce driver-related costs and scale its services.
- Strategic Investments – The company is using its strong cash flow to fund innovation, product development, acquisitions, and minority investments, driving long-term value.
- Capital-Efficient Growth – Uber’s ability to expand its service platform with minimal capital investment is expected to accelerate revenue growth and shareholder value creation.
Price Target & Options Flow:
Tigress Financial has raised Uber’s price target from $103 to $110, maintaining a Buy rating. Additionally, option flow on Uber is showing strong bullish activity, suggesting institutional interest. Given this momentum, Uber could potentially surpass $95 before August, especially if AV advancements and AI-driven efficiencies continue to strengthen its financial outlook

#UBERUber shares will fall by at least 60% due to the blatant and flagrant infringement of Carma Technology's patents.

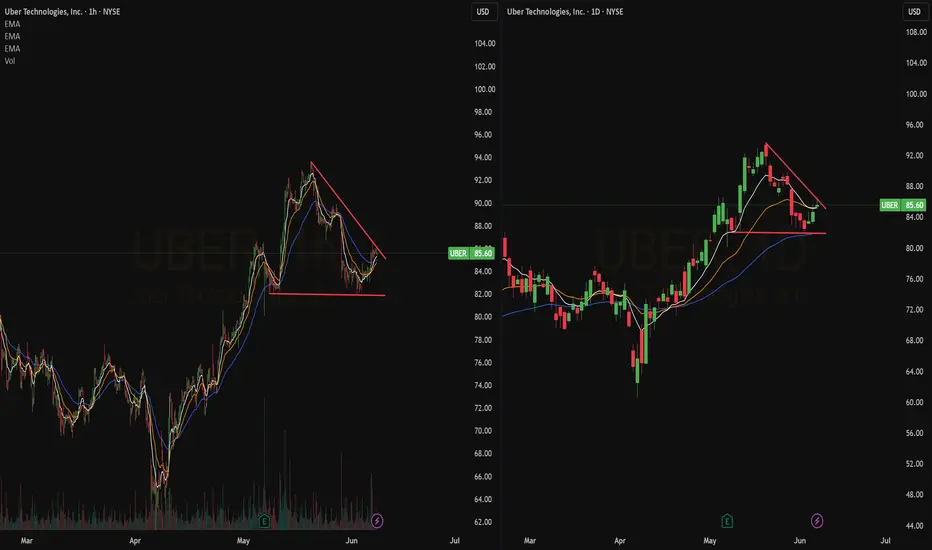
Quick View: $UBER- Bullish setup on the daily that sees a triangle with support found on the ema 50Daily.
- Classic pullback on the hourly
Area of $86-$87 as key resistance.
Support → $81

UBER – Momentum Pullback to 20 SMA: Classic Continuation SetupUber is giving one of my favorite swing setups — a shallow pullback into the “bone zone” (between the 9 EMA and 20 SMA) during a hot market.
🔹 Trend Continuation Play
Strong momentum stock pulling back right into the 20 SMA — not a deep retrace, just enough to reload.
In hot markets, I don’t wait for deep dips — I want tight consolidations into momentum zones.
🔹 The Bone Zone Setup
The shaded area between the 9 EMA and 20 SMA is where momentum stocks often base before the next leg up.
Price is respecting that zone perfectly — no breakdown, just controlled digestion.
🔹 Oversold Stochastics
Stochastics are in oversold territory — adds confirmation that this is a high-quality dip within a strong trend.
My Trade Plan:
1️⃣ Entry: Looking to start a swing position off the 20 SMA.
2️⃣ Add: On confirmation candle back above 9 EMA with volume.
3️⃣ Stop: Below 20 SMA lows — tight risk, strong reward if trend continues.
Why I Love This Setup:
Market’s hot — I want to ride strength, not fade it.
NYSE:UBER is a trending name with institutional accumulation.
This pattern has worked again and again in strong tape.

Bullish UBERThe 2-week candlestick performance of Uber Technologies highlights a large consolidation zone between $60 and $88. The price is currently testing heavy resistance around $88, a level that previously triggered multiple rejections.
A confirmed breakout above this level projects a potential 42% upside towards the $120 –$125 range.
Target : $125.00

$UBER looks like a bargain to me in FY 2025. PT $95-104- Uber's capital-light business model has been a major boon to their growth and global expansion efforts, whereas robotaxi will be capital extensive.
- The biggest worry regarding robotaxi implementation is the up-front capital required to get the required vehicle fleet on the road, and the years it may take to get the operations running efficiently. However, I don't think that the fear of robotaxi is overblown, as it is simply not a suitable business model in comparison to Uber's current infrastructure.
- I don't believe robotaxi fears will have materialistic impact on Ubers financials for years to come. Therefore, NYSE:UBER is a strong buy for me and I am comfortable in holding this stock and adding more if it dips.

Uber (UBER, 1W) Tightening Structure Ready for BreakoutOn the weekly chart, UBER has formed a strong ascending wedge / tightening channel, showing clear higher lows and repeated rejections near upper resistance. The price is now approaching the apex of the pattern, with a possible breakout setup above $82.42.
If confirmed, the projected measured move (H = $27.67) aligns with Fibonacci extension targets at:
– $89.86 (1.272)
– $93.74 (1.414)
– $99.32 (1.618)
Technical structure:
– Price held support twice, confirming bullish intent
– Structure tightening — breakout likely on sustained volume
– Bullish divergence forming on the weekly stochastic oscillator
– A breakout above $82.42 activates the next impulse wave
– Volume is stable, with no signs of heavy distribution
Fundamentals:
Uber has reached a major financial milestone: consistent profitability and positive EBITDA growth. The company continues to expand across mobility and delivery, with a focus on cost efficiency, platform monetization, and retention. Increased user activity and growing institutional interest support a bullish mid-term thesis. Uber is increasingly seen as a core holding in next-gen tech and services portfolios.
The technical structure is approaching resolution. A confirmed breakout above $82.42 opens the door for a move to $89.86 → $93.74 → $99.32. With bullish structure and improving fundamentals, Uber is positioned for the next leg higher. This is a setup worth watching.

Why Your EMA Isn't What You Think It IsMany new traders adopt the Exponential Moving Average (EMA) believing it's simply a "better Simple Moving Average (SMA)". This common misconception leads to fundamental misunderstandings about how EMA works and when to use it.
EMA and SMA differ at their core. SMA use a window of finite number of data points, giving equal weight to each data point in the calculation period. This makes SMA a Finite Impulse Response (FIR) filter in signal processing terms. Remember that FIR means that "all that we need is the 'period' number of data points" to calculate the filter value. Anything beyond the given period is not relevant to FIR filters – much like how a security camera with 14-day storage automatically overwrites older footage, making last month's activity completely invisible regardless of how important it might have been.
EMA, however, is an Infinite Impulse Response (IIR) filter. It uses ALL historical data, with each past price having a diminishing - but never zero - influence on the calculated value. This creates an EMA response that extends infinitely into the past—not just for the last N periods. IIR filters cannot be precise if we give them only a 'period' number of data to work on - they will be off-target significantly due to lack of context, like trying to understand Game of Thrones by watching only the final season and wondering why everyone's so upset about that dragon lady going full pyromaniac.
If we only consider a number of data points equal to the EMA's period, we are capturing no more than 86.5% of the total weight of the EMA calculation. Relying on he period window alone (the warm-up period) will provide only 1 - (1 / e^2) weights, which is approximately 1−0.1353 = 0.8647 = 86.5%. That's like claiming you've read a book when you've skipped the first few chapters – technically, you got most of it, but you probably miss some crucial early context.
▶️ What is period in EMA used for?
What does a period parameter really mean for EMA? When we select a 15-period EMA, we're not selecting a window of 15 data points as with an SMA. Instead, we are using that number to calculate a decay factor (α) that determines how quickly older data loses influence in EMA result. Every trader knows EMA calculation: α = 1 / (1+period) – or at least every trader claims to know this while secretly checking the formula when they need it.
Thinking in terms of "period" seriously restricts EMA. The α parameter can be - should be! - any value between 0.0 and 1.0, offering infinite tuning possibilities of the indicator. When we limit ourselves to whole-number periods that we use in FIR indicators, we can only access a small subset of possible IIR calculations – it's like having access to the entire RGB color spectrum with 16.7 million possible colors but stubbornly sticking to the 8 basic crayons in a child's first art set because the coloring book only mentioned those by name.
For example:
Period 10 → alpha = 0.1818
Period 11 → alpha = 0.1667
What about wanting an alpha of 0.17, which might yield superior returns in your strategy that uses EMA? No whole-number period can provide this! Direct α parameterization offers more precision, much like how an analog tuner lets you find the perfect radio frequency while digital presets force you to choose only from predetermined stations, potentially missing the clearest signal sitting right between channels.
Sidenote: the choice of α = 1 / (1+period) is just a convention from 1970s, probably started by J. Welles Wilder, who popularized the use of the 14-day EMA. It was designed to create an approximate equivalence between EMA and SMA over the same number of periods, even thought SMA needs a period window (as it is FIR filter) and EMA doesn't. In reality, the decay factor α in EMA should be allowed any valye between 0.0 and 1.0, not just some discrete values derived from an integer-based period! Algorithmic systems should find the best α decay for EMA directly, allowing the system to fine-tune at will and not through conversion of integer period to float α decay – though this might put a few traditionalist traders into early retirement. Well, to prevent that, most traditionalist implementations of EMA only use period and no alpha at all. Heaven forbid we disturb people who print their charts on paper, draw trendlines with rulers, and insist the market "feels different" since computers do algotrading!
▶️ Calculating EMAs Efficiently
The standard textbook formula for EMA is:
EMA = CurrentPrice × alpha + PreviousEMA × (1 - alpha)
But did you know that a more efficient version exists, once you apply a tiny bit of high school algebra:
EMA = alpha × (CurrentPrice - PreviousEMA) + PreviousEMA
The first one requires three operations: 2 multiplications + 1 addition. The second one also requires three ops: 1 multiplication + 1 addition + 1 subtraction.
That's pathetic, you say? Not worth implementing? In most computational models, multiplications cost much more than additions/subtractions – much like how ordering dessert costs more than asking for a water refill at restaurants.
Relative CPU cost of float operations :
Addition/Subtraction: ~1 cycle
Multiplication: ~5 cycles (depending on precision and architecture)
Now you see the difference? 2 * 5 + 1 = 11 against 5 + 1 + 1 = 7. That is ≈ 36.36% efficiency gain just by swapping formulas around! And making your high school math teacher proud enough to finally put your test on the refrigerator.
▶️ The Warmup Problem: how to start the EMA sequence right
How do we calculate the first EMA value when there's no previous EMA available? Let's see some possible options used throughout the history:
Start with zero : EMA(0) = 0. This creates stupidly large distortion until enough bars pass for the horrible effect to diminish – like starting a trading account with zero balance but backdating a year of missed trades, then watching your balance struggle to climb out of a phantom debt for months.
Start with first price : EMA(0) = first price. This is better than starting with zero, but still causes initial distortion that will be extra-bad if the first price is an outlier – like forming your entire opinion of a stock based solely on its IPO day price, then wondering why your model is tanking for weeks afterward.
Use SMA for warmup : This is the tradition from the pencil-and-paper era of technical analysis – when calculators were luxury items and "algorithmic trading" meant your broker had neat handwriting. We first calculate an SMA over the initial period, then kickstart the EMA with this average value. It's widely used due to tradition, not merit, creating a mathematical Frankenstein that uses an FIR filter (SMA) during the initial period before abruptly switching to an IIR filter (EMA). This methodology is so aesthetically offensive (abrupt kink on the transition from SMA to EMA) that charting platforms hide these early values entirely, pretending EMA simply doesn't exist until the warmup period passes – the technical analysis equivalent of sweeping dust under the rug.
Use WMA for warmup : This one was never popular because it is harder to calculate with a pencil - compared to using simple SMA for warmup. Weighted Moving Average provides a much better approximation of a starting value as its linear descending profile is much closer to the EMA's decay profile.
These methods all share one problem: they produce inaccurate initial values that traders often hide or discard, much like how hedge funds conveniently report awesome performance "since strategy inception" only after their disastrous first quarter has been surgically removed from the track record.
▶️ A Better Way to start EMA: Decaying compensation
Think of it this way: An ideal EMA uses an infinite history of prices, but we only have data starting from a specific point. This creates a problem - our EMA starts with an incorrect assumption that all previous prices were all zero, all close, or all average – like trying to write someone's biography but only having information about their life since last Tuesday.
But there is a better way. It requires more than high school math comprehension and is more computationally intensive, but is mathematically correct and numerically stable. This approach involves compensating calculated EMA values for the "phantom data" that would have existed before our first price point.
Here's how phantom data compensation works:
We start our normal EMA calculation:
EMA_today = EMA_yesterday + α × (Price_today - EMA_yesterday)
But we add a correction factor that adjusts for the missing history:
Correction = 1 at the start
Correction = Correction × (1-α) after each calculation
We then apply this correction:
True_EMA = Raw_EMA / (1-Correction)
This correction factor starts at 1 (full compensation effect) and gets exponentially smaller with each new price bar. After enough data points, the correction becomes so small (i.e., below 0.0000000001) that we can stop applying it as it is no longer relevant.
Let's see how this works in practice:
For the first price bar:
Raw_EMA = 0
Correction = 1
True_EMA = Price (since 0 ÷ (1-1) is undefined, we use the first price)
For the second price bar:
Raw_EMA = α × (Price_2 - 0) + 0 = α × Price_2
Correction = 1 × (1-α) = (1-α)
True_EMA = α × Price_2 ÷ (1-(1-α)) = Price_2
For the third price bar:
Raw_EMA updates using the standard formula
Correction = (1-α) × (1-α) = (1-α)²
True_EMA = Raw_EMA ÷ (1-(1-α)²)
With each new price, the correction factor shrinks exponentially. After about -log₁₀(1e-10)/log₁₀(1-α) bars, the correction becomes negligible, and our EMA calculation matches what we would get if we had infinite historical data.
This approach provides accurate EMA values from the very first calculation. There's no need to use SMA for warmup or discard early values before output converges - EMA is mathematically correct from first value, ready to party without the awkward warmup phase.
Here is Pine Script 6 implementation of EMA that can take alpha parameter directly (or period if desired), returns valid values from the start, is resilient to dirty input values, uses decaying compensator instead of SMA, and uses the least amount of computational cycles possible.
// Enhanced EMA function with proper initialization and efficient calculation
ema(series float source, simple int period=0, simple float alpha=0)=>
// Input validation - one of alpha or period must be provided
if alpha<=0 and period<=0
runtime.error("Alpha or period must be provided")
// Calculate alpha from period if alpha not directly specified
float a = alpha > 0 ? alpha : 2.0 / math.max(period, 1)
// Initialize variables for EMA calculation
var float ema = na // Stores raw EMA value
var float result = na // Stores final corrected EMA
var float e = 1.0 // Decay compensation factor
var bool warmup = true // Flag for warmup phase
if not na(source)
if na(ema)
// First value case - initialize EMA to zero
// (we'll correct this immediately with the compensation)
ema := 0
result := source
else
// Standard EMA calculation (optimized formula)
ema := a * (source - ema) + ema
if warmup
// During warmup phase, apply decay compensation
e *= (1-a) // Update decay factor
float c = 1.0 / (1.0 - e) // Calculate correction multiplier
result := c * ema // Apply correction
// Stop warmup phase when correction becomes negligible
if e <= 1e-10
warmup := false
else
// After warmup, EMA operates without correction
result := ema
result // Return the properly compensated EMA value
▶️ CONCLUSION
EMA isn't just a "better SMA"—it is a fundamentally different tool, like how a submarine differs from a sailboat – both float, but the similarities end there. EMA responds to inputs differently, weighs historical data differently, and requires different initialization techniques.
By understanding these differences, traders can make more informed decisions about when and how to use EMA in trading strategies. And as EMA is embedded in so many other complex and compound indicators and strategies, if system uses tainted and inferior EMA calculatiomn, it is doing a disservice to all derivative indicators too – like building a skyscraper on a foundation of Jell-O.
The next time you add an EMA to your chart, remember: you're not just looking at a "faster moving average." You're using an INFINITE IMPULSE RESPONSE filter that carries the echo of all previous price actions, properly weighted to help make better trading decisions.
EMA done right might significantly improve the quality of all signals, strategies, and trades that rely on EMA somewhere deep in its algorithmic bowels – proving once again that math skills are indeed useful after high school, no matter what your guidance counselor told you.

Super Performance CandidateNYSE:UBER , dominant market position, strong financials, a true market leader emerging from a solid base under market circumstances, aiding to Bill Ackman's recent most stake, heightening conviction. At a RS Rating of 89,
I have reasons to believe this security price can increase.

Uber ResistanceIn Q1 2025, Uber reported earnings per share of $0.83, a significant improvement from a loss of $0.32 in the same quarter last year. Revenue increased by 14% year-over-year to $11.5 billion .
Investor's Business Daily
Recently, Uber announced a $1 billion offering of senior notes exchangeable for shares of Aurora Innovation, a move that impacted Aurora's stock price . Additionally, Uber introduced new services like Route Share and expanded membership passes to enhance affordability and attract more users .
Analysts, including Evercore ISI, maintain an "Outperform" rating on Uber, with a price target of $115, reflecting confidence in the company's growth prospects .
Investor's Business Daily

UBER - buy low , sell highhi traders
we are analysing the weekly chart of Uber Technologies Inc. (NYSE:UBER), where we observe a significant technical structure forming.
We see the price moving within an ascending channel, indicating this macro uptrend.
Currently, the price has reached the upper boundary of the channel, at $91 and we expect to see a potential rejection here.
The projected pattern on the chart shows a possible pullback which I have indicated.
Enter a long position when the price reaches the upsloping trendline (bottom of the channel)
Target: The upper boundary of the channel .
Stop loss: $60

UBERUBER -- possible trade opportunity
Based on:
1-General market conditions.
2-Sector analysis.
3-Company earning and sales.
4-Chart patterns.

#Uber Weekly Outlook!🚀
UBER
#Uber Weekly Outlook!
🎈 We can see the stock is significantly Overbought. Additionally, the Bollinger Bands are starting to narrow in extreme zones!
📊 I’ve marked previous correction zones with trendlines and highlighted a potential correction area!

OptionsMastery: Daily resistance on UBER! 🔉Sound on!🔉
📣Make sure to watch fullscreen!📣
Thank you as always for watching my videos. I hope that you learned something very educational! Please feel free to like, share, and comment on this post. Remember only risk what you are willing to lose. Trading is very risky but it can change your life!

Uber at the Edge: Technical Signals Flash Warning as Price TestsUber Technologies (UBER) has been consolidating in a broad range and is now testing a major breakout above a significant resistance zone around the $81–$85 level, which historically capped price in early 2024.
1. Resistance Zone
Uber is pressing up against a multi-year resistance zone (~$83–$85).
Last breakout attempt (Feb–Mar 2024) resulted in a sharp rejection, forming a double-top structure.
2. Volume
Volume on this breakout is not significantly higher than previous sessions. Lack of strong volume confirmation is a yellow flag — bullish breakouts need conviction.
3. RSI (Relative Strength Index) – 4H: 73.91
Overbought territory (>70).
This is not sustainable for long without a cooling-off.
Bearish divergence alert: If UBER makes a higher high while RSI starts to slope downward, that would be a classic top signal.
4 MACD
MACD line is still rising, but very close to prior highs seen during failed breakouts.
The histogram shows momentum fading — peaks are lower despite price pushing to the high end of the range.
Potential bearish crossover incoming on further weakness.
5. Fibonacci Retracement
From the 2021 high to the 2022 low, the current price is pressing near the 78.6% retracement (~$85 area) — a classic reversal zone for tops.
Also aligns with prior horizontal resistance — confluence adds weight to this level being a potential top.
6. Sentiment
Sentiment around Uber has been improving — profitability inflection point, bullish news, positive guidance.
However, extreme optimism often accompanies tops. If everyone is bullish, who's left to buy?
Conclusion: A Probable Short-Term Top Forming
We now have RSI overbought, MACD momentum fading, no volume confirmation, and price pushing into a multi-year resistance cluster — this screams risk of a reversal.
This is a high-probability short setup for traders, especially if:
Price fails to close above $86.00 convincingly
RSI starts to diverge lower
MACD crosses down
A pullback to $75–78 is very likely on rejection.

Is Uber a good buy at the current price? Here is whyHello,
Here is our outlook on Uber Technologies.
Uber Technologies, Inc provides a platform that allows users to access transportation and food ordering services. The Company operates through two segments: Core Platform and Other Bets.
The Core Platform segment consists of Ridesharing and Uber Eats. The Other bets segment consists of Uber Freight and New Mobility platforms. Ridesharing refers to products that connects consumers with drivers who provide rides in a variety of vehicles, such as cars, auto rickshaws, motorbikes, minibuses and taxis. Its Uber Eats platform allows consumers to search for and discover local restaurants and order meals through online.
TECHNICAL ANALYSIS- Checklist
Structure drawing (Trend line drawing on past price chart data)
Patterns identification (Naming patterns on past price chart data for future wave)- A correction forming. Price is at the bottom of the corrective wave.
Future indication (Reading indicator for future wave)- Await zero crossover on MACD
Future wave (Drawing on future price chart using future indication from indicator)- As shown in chart
Future reversal point (Identifying trend reversal point on price chart using structure)- Target at $100 per share
Uber Technologies, Inc. financial performance for Q3 2024 and the nine months ended September 30, 2024.
Total Revenue: $11,188 million for Q3 2024, $32,019 million for the nine months ended September 30, 2024.
Income from Operations: $1,061 million for Q3 2024, $2,029 million for the nine months ended September 30, 2024.
Net Income including Non-Controlling Interests: $2,599 million for Q3 2024, $2,944 million for the nine months ended September 30, 2024.
Net Income Attributable to Uber Technologies, Inc.: $2,612 million for Q3 2024, $2,973 million for the nine months ended September 30, 2024.
Basic Net Income per Share Attributable to Uber Technologies, Inc. Common Stockholders: $1.24 for Q3 2024, $1.42 for the nine months ended September 30, 2024.
Diluted Net Income per Share Attributable to Uber Technologies, Inc. Common Stockholders: $1.20 for Q3 2024, $1.36 for the nine months ended September 30, 2024.
Revenue from the United States and Canada was $17,304 million, Latin America was $2,068 million, Europe, Middle East, and Africa was $8,939 million, and Asia Pacific was $3,708 million for the nine months ended September 30, 2024.
Uber announced the pending acquisition of Foodpanda Taiwan from Delivery Hero SE for approximately $950 million in cash, expected to close in the first half of 2025.
Beginning in early 2025, Waymo and Uber will bring autonomous ride-hailing to Austin and Atlanta, only on the Uber app. In these cities, Uber will manage and dispatch a fleet of Waymo’s fully autonomous, all-electric Jaguar I-PACE vehicles that will grow to hundreds over time.
You can find a summary of financial statements here:
Our recommendation
Since February 2024, Uber's stock (UBER) has been undergoing a correction, largely driven by concerns over the rise of robotaxi services potentially eroding the market share of traditional ride-hailing giants like Uber and Lyft. Notably, Waymo—Alphabet's autonomous vehicle division—recently expanded to Miami and now completes over 150,000 self-driving rides per week. Tesla is also set to enter the space with a planned robo-taxi launch in late 2025.
However, Uber is not sitting idle. The company, in collaboration with WeRide, has launched an autonomous mobility service in Abu Dhabi and is targeting fully driverless commercial services by late 2025 in the same region. This demonstrates Uber's proactive strategy to stay competitive in the evolving ride-hailing landscape. Beginning in early 2025, Waymo and Uber will bring autonomous ride-hailing to Austin and Atlanta, only on the Uber app.
The sharp decline in Uber's stock price—down 34% in recent weeks. The MACD indicator is showing that we shall be having a zero crossover soon hence suggesting that selling pressure may be nearing exhaustion, potentially signalling a trend reversal. The stock appears poised to recover and return to a more balanced supply-and-demand dynamic.
Despite current challenges, we expect Uber to remain resilient and successfully navigate market headwinds. The current price level presents a compelling buying opportunity, with a target price of $100.00 offering significant upside potential for investors who act now.
Current price: $60.80
Good luck and best regards.

UBER: Looking for the next breakoutUBER quarterly earnings may be the catalyst we need to register a new 52wk High, and breakout to a new price range
if the breakout happens, most traders will be looking at a TP target of around ~$100 to $105 , with SL $75 for a conservative 2:1 R/R.
However, broader market conditions are not that encouraging so that move may take longer to happen, if it doesn't breakdown on some bad news

Uber may rise to 84.74 - 88.50NYSE:UBER
Above 69.92 support, target for 88.50
Below 69.92 support, expect 63.81 and 60.18.
The RSI is above its neutrality area at 50. The MACD is below its signal line and positive. The price could retrace.
