Waiting For a Deep Pullback In UberIn this trade idea I explain what I am looking for in $NYSE:UBER. The top channel is hit and next we just need to wait for a deeper pullback so that we can enter with a health 3+:1 RR.
UBERB trade ideas


UBER - Short set upBearish Divergence on 1H TF, planning to enter short on break of support and have my sell stop / entry at 68.65
Entry - 68.65
Stoploss - 69.71
TP-1 -67.59
TP-2 - 66.56
#Trading #Technical #Crypto #Stocks #commodities

Waiting for a breakout to the upside for UBER!🔉Sound on!🔉
Thank you as always for watching my videos. I hope that you learned something very educational! Please feel free to like, share, and comment on this post. Remember only risk what you are willing to lose. Trading is very risky but it can change your life!

UBER Short Momentum SwingInverted momentum swing on UBER
price drops, corrects with small rise in price
consolidates with lower highs and lows in a channel
after it breaks out of channel you short

Eyes on $UberEyes on $Uber! 📊 Entering a support zone with promising volume profile and previous highs in sight. RSI divergence adds to the positive outlook. Target: $70.
Stop loss $61

UBER may give your bank account a ride to the upsideWhile the indicators don't currently show strong upside confluence with the forecast, strong upside volume would be a good indicator of possible all-time highs. Remember that as we near the upper portion of wave 3, we expect divergences to build.

Uber comeback time? Touched the WVAP from october 2023 low.
Daily RSI Divergence.
OBV Balance positive.
Volume increased.
Have been lagging for awhile.
Time to get back in silence?

it's time to going up for UBERbefore buying, please check for being sure about your opinion about this CRYPTOCURRENCY!!!
(in every target you want, closed the position but our target is the third one)
*Guy's the entry place is importance things in enter in a position and be careful do not going up your leverage over 7x ,all things it's about risk management*
*************************************************
if you want to enter in this position:
Enter Price: 65.68
Target1: 66.94
Target2: 68.41
Target3: 70.20
Target4(Final Target): 71.64
Stoploss: 63.71
*************************************************
Guy's if this idea was useful and it was intresting for you please follow for more
please do comment and like my idea
If you like my idea show me in comment section
doing and living in the best quality
thanks of all of you dear's ;)

Uber Technologies, Inc.In this technical analysis of Uber Technologies, Inc. (NYSE: UBER), we delve into various indicators and recent price actions to forecast potential market movements and suggest strategic trades. Uber's stock has shown significant volatility, and by integrating technical insights with a speculative touch on potential price targets, this analysis aims to guide traders with actionable recommendations.
Uber's recent price movement has seen a decline from its peak at $82.14, marked by a series of red candlesticks indicating selling pressure. The price correction down to $66.43 could be attributed to profit-taking and market sentiment adjustments. The latest candlestick formation, coupled with increased volume, suggests a continued interest in the asset, which could precede either a potential reversal or further declines.
* Moving Averages: The 50-day Exponential Moving Average (EMA) is showing a buy signal, currently positioned at 59.44, which suggests that the price may find support around these levels. However, shorter-term EMAs (10-day and 20-day) have positioned themselves for a sell, indicating near-term bearish pressure.
* MACD (Moving Average Convergence Divergence): The MACD levels present a sell signal with a current reading at 4.08. The negative divergence from the signal line emphasizes the increasing bearish momentum.
* RSI (Relative Strength Index): Currently at 49.56, the RSI is neutral, reflecting a balance between buying and selling pressures. However, this neutrality near the midpoint can pivot swiftly with market dynamics.
* Fibonacci Retracement: Observing the Fibonacci retracement levels from the previous high at $82.14 to a significant low at $40.09, key resistance is noted around $66.08 (0.382 retracement level). A break above this could lead to testing higher resistance near $71.63 (0.5 level).
The increased volume on down days and the price below recent high suggest that sentiment has turned cautious, with traders potentially looking for confirmation before initiating large positions.
* Long Position: Consider entering a long position if the price rebounds and holds above the $66.08 Fibonacci level. A conservative target for this trade would be near the $71.63 level, with a stretch goal at $75.06 (R1 pivot point). Place a stop loss at $63.84, slightly below the recent swing low, to manage risk effectively.
* Short Position: Should the price fail to hold the $66.08 level and shows signs of weakness, initiating a short position could be advantageous. The immediate target for this setup would be around $60.09 (previous support), with a further bearish outlook potentially extending to $50.04 (P pivot level). The stop loss for this position should be placed just above the $71.63 Fibonacci retracement level to limit potential losses from a reversal.
Uber Technologies, Inc. presents an intriguing opportunity for traders with its current volatility and technical setup. The recommended strategies involve clear entry points, target levels, and stop-loss placements to optimize the trading outcomes while managing risks. Continued monitoring of Uber's stock, alongside market news and economic indicators, will be crucial to adjusting strategies as market conditions evolve.

$UBERNot financial advice.
NYSE:UBER
Following is trajectory for wave 4, if so to retest the top of the trendline will see if it holds and continues it's way back to finish wave 5. Also aligns with Fibonacci count.
Like and subscribe for more ideas.

Uber Posts Q1 Results That Beat Expectations for RevenueUber (NYSE: NYSE:UBER ) announced its first-quarter results on Wednesday, which surpassed analysts' revenue estimates but also reported a net loss. The company's revenue increased by 15% to $10.13 billion year over year. However, the gross bookings fell short of expectations, with the company reporting $37.65 billion, compared to the $37.93 billion expected by industry analysts.
The net loss of the company widened to $654 million, compared to a loss of $157 million in the same quarter the previous year. Uber ( NYSE:UBER ) attributed this loss to a $721 million net headwind from unrealized losses related to the reevaluation of its equity investments. The company's adjusted EBITDA was $1.38 billion, up 82% year over year, which is slightly higher than the $1.31 billion anticipated by analysts.
Uber's monthly active platform consumers reached 149 million in Q1, up by 15% YoY from 130 million. During the same period, there were 2.6 billion trips completed on the platform, a 21% YoY increase. The company's mobility segment reported $5.63 billion in revenue, up 30% YoY, and 2% QoQ. The delivery segment reported $3.21 billion in revenue, up 4% YoY and 3% QoQ. The freight business booked $1.28 billion, a decrease of 8% YoY and flat QoQ.
In Q2, Uber expects to report gross bookings between $38.75 billion and $40.25 billion, with adjusted EBITDA of $1.45 billion to $1.53 billion. The company's CEO, Dara Khosrowshahi, said that the loss had "nothing to do with the operating business" and that the company does not expect it to keep happening going forward. Khosrowshahi added that Uber cannot predict the markets.
Despite the loss, Khosrowshahi stated that the demand for Uber remains strong across their platform, supported by their improving marketplace experience, the continued shift of consumer spending from goods to services, and the secular trend towards on-demand transportation and delivery. The company is focused on increasing its penetration of core use cases while expanding into new consumer segments to drive user growth and win more of their daily trips.

UBER Technologies Options Ahead of EarningsIf you haven`t bought UBER before the previous earnings:
Then analyzing the options chain and the chart patterns of UBER Technologies prior to the earnings report this week,
I would consider purchasing the 80usd strike price Calls with
an expiration date of 2025-1-17,
for a premium of approximately $6.85.
If these options prove to be profitable prior to the earnings release, I would sell at least half of them.


The market moves in waves and the next one is coming soon. UBER has a clear cycle of about 6 months.
- The 3 Lines are all down and form a tribble bottom
- The RSI is oversold
UBER can come a bit lower but the reversal is near.

UberWeekly chart.. Major rising wedge forming here.. Price is now correcting back to supporting trendline.. expect a move down to 50-53 before a final leg up to new highs.. Major correction coming 2025.
Short entry for now is below 68.00.. 68 as you can see is major fib and also 100ma is around 69.. wait for a close below 68 and short with your first target 57$ gap close..
70.00 stop loss

👀WATCHLIST: UBER /potential re-entry/UBER is on my watchlist for this week
I am looking for a pivot creation within the orange zone
I have traded UBER in the annotated points in the past
I have left the annotations so that you can see my trading style
A pivot breakout with a good volume would signal a buy for me
I am looking at 'cheat' buy.

UBER - Short to fill the gapsShort Entry - anywhere now
Stop Loss - 80
Target #1 - 74
Target #2 - 69
if broader market tanks for whatever reason, Target #3 - 60 or below
Looking EXTREMELY bullish on UBER!🔉Sound on!🔉
Thank you as always for watching my videos. I hope that you learned something very educational! Please feel free to like, share, and comment on this post. Remember only risk what you are willing to lose. Trading is very risky but it can change your life!

UBER Forming a “Head and Shoulders”UBER is forming a “Head and Shoulder” patter after bouncing from All-Time Highs for a 3rd time, also has a gap to fill to the downside @ $69

1hr bull flag to breakout BIGTIMEMoving up fast, I threw like $3.3k at calls. I like $80 or $90 strike. I also enjoy long expiry. NFA and do your own research. I'm a trader

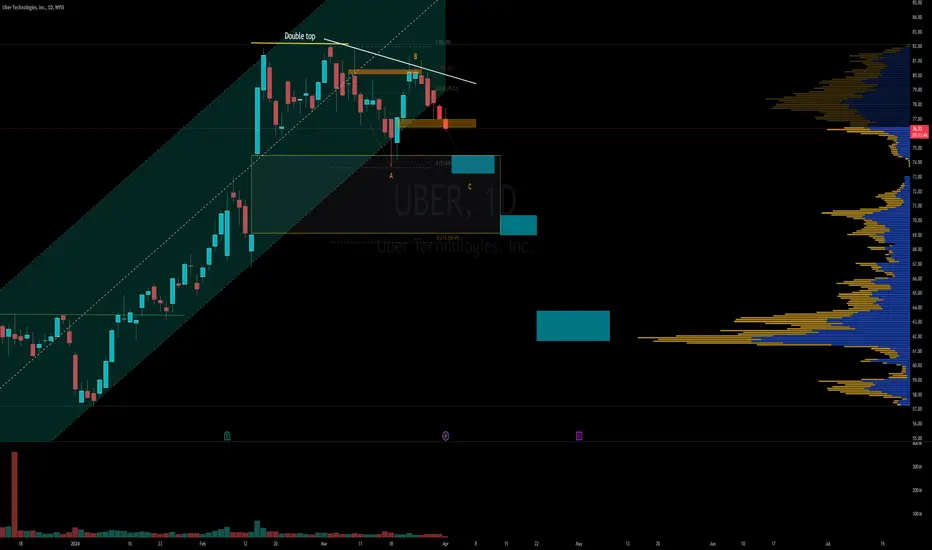
UBERRetracing back from its all time high. The current zone drawn is there to follow its trend in the next few days/ weeks

Uber starting to stallUbers momentum indicators and price action has started to stall while sideways distribution patterns are printing out. This is since hitting key fib extensions that uber has previously reacted strongly off of. I expect uber to start retracing very soon and start a slow down tread looking to retest $50-$59 price block area.
