UBER Quick PutI'm looking for UBER to the downside come Monday, RSI super overbought and MACD showing signs of big reversal potential
UBERD trade ideas

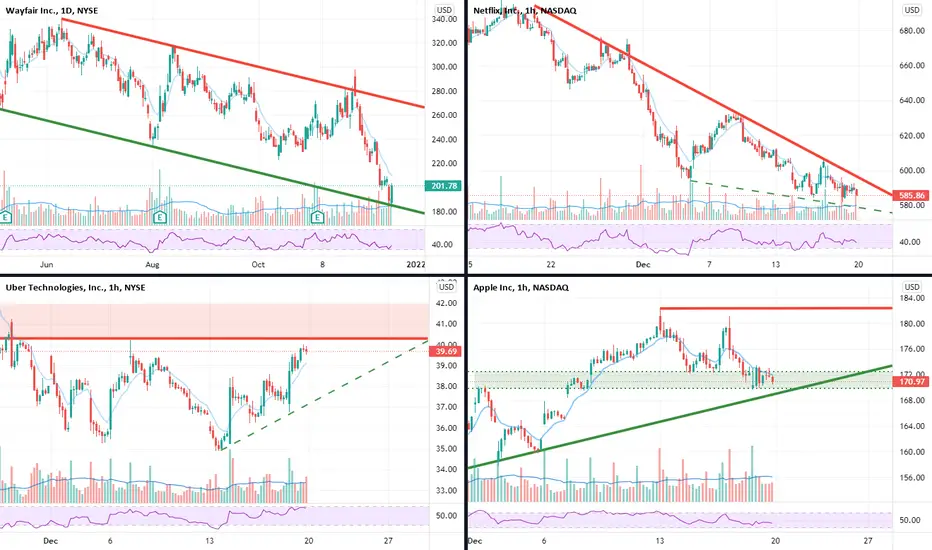
$W $NFLX $UBER $AAPL I OptionsSwing WatchlistW 1D I As stay at home stocks bounced a bit last Friday, we had W bounce 8%+ right at our support. W seems to be forming a bull flag on the daily chart.
NFLX 1H I NFLX is down more than 15% from all time high levels. Watching for a breakout from this downtrend, for either a relief bounce or a stay at home stocks rally.
UBER 1H I UBER double bottom near $35. Watching for a consolidation above $39. It is a bit extended from the 9 EMA on the hourly after bouncing 13%+ from $35.
AAPL 1H I AAPL is down 10 points after hitting a double top near $180. It seems to be consolidating right over $170 and we'll see this week if it remains on an uptrend.

UBERThere is little to say here. There is a diversion on MFI during the week, diversion on MFI and RSI on a daily basis and it has already won back and it is difficult to say for sure whether it will continue to move. Also, what is bought back from the PIVOT level, the wave counting is conditional. Long from 40 may be interesting, but not the safest.
There is a SPECULATIVE option. Reasoning on the topic.
We are seeing a corrective movement within expended flat or running flat to b-wave. Previously, there was a three down, then we have another three with an extended C. And now we can have both the end of C in 5 waves (running flat), and a departure below 20 and / or 13 (expended flat). For running flat, the problem is that we hit 40 before, it would be ideal there, but we are not far away.
You can also see the Wolfe wave. But on such timeframes it makes little sense. IMHO

UBER Weekly Options PlayDescription
UBER began its bear market after the break in the major trendline July. It has now broken through major support established from the ascending triangle that was built in MAR - NOV timeframe of 20' and was also tested in SEP of 21'.
The break through 38 is the signal for the entry, and also the stop loss for the position.
Using long puts to leave the downside open.
The level of the VIX right now is my primary concern in opening long option positions. I consider all of my positions risky, and manage risk accordingly.
Long Put
Levels on Chart
SL > 38
PT : 33*
*Stops based off underlying stock price, not mark to market loss
The Trade
BUY
12/17 34P
R/R & Breakevens vary on fill.
*At 33 I will take profits, and roll to OTM puts.
The Long put is placed OTM for higher profit percentage, but before the target price for max chance of success by expiration.
Manage Risk
Only invest what you are willing to lose


$UBER Target 29.14$UBER Target 29.14
Technical weakness here is pointing to a move lower…
GL, and let me know your thoughts!!
——————
I usually trade both ways, but lately I’ve been focusing more to the downside because of how high the market is. It makes more sense to sell puts right now, and that's what I'm doing at the moment.
——————
I am not your financial advisor, but I will happily answer questions and analyze to the best of my ability but ultimately the risk is on you. Check out my ideas, but also do your own due diligence.
I am not a bull. I am not a bear. I just see what I see in the charts and I don’t pay too much attention to the noise in the news.
Very often you have to look at my charts from the perspective of where I’m looking to sell puts. But I also do open positions still once in a while.
If you want me to analyze any stock or ETF just leave me a comment and I’ll do it if I can.
Have fun, y’all!!
(\_/)
( •_•)
/ >🚀


$UBER - Inverted cup and handle break down target 50% paid In previous chart I had published that Uber was playing out inverted cup and handle with maximum break down target of $28 area.
Now it has paid 50% of the break down target and filled the gap that was left in Nov 2020 at $36.15 area. 50% is some cases the reversal can happen.
Can it happen? Who knows?
If this area does not hold, it can break down to $32.50 area. For both bulls and bears, areas to watch for support and reversal areas are -
Support 1 - $36 (50% breakdown)
Support 2 - $32.50
Support 3 - $28
———————————————————
How to read my charts?
- Matching color trend lines shows the pattern. Sometimes a chart can have multiple patterns. Each pattern will have matching color trend lines.
- The yellow horizontal lines shows support and resistance areas.
- Fib lines also shows support and resistance areas.
- The dotted white lines shows price projection for breakout or breakdown target.
Disclaimer: Do your own DD. Not an investment advice.

falling wedge detected 🍿i love this falling wedge pattern here on $uber, once it breaks we can target 47-52 local resistance areas.
I'll wait for confirmation first but its definitely on the watchlist.
good luck! like and follow for more 💘

UBER BULLISH SWINGThis could be a simultaneous AB=CD and wedge pattern that play out. If thats the case we have a distinct posibility of making 100%+ within a 12 month timeframe. We have just had a productive bounce in the bottom of the wedge. Of course I'd prefer the bounce with a rejection candle, but the UBER stock has no history of doing nice candles in its bounces, so this bounce will do. the latest low incidently also closed the gap from nov 2020. No more gaps to cover on the downside. If we put our SL below 35 and aim for a harmonic play out of AB=CD we have very nice risk reward. Those seeking more confirmation can wait 2 closes above the wedge "roof" before entry. Hope we see some über bullish action ;-)


UBER bouncelooking spicy
-39.1 will be used as a pivot; large dark pool print at this level around Sept 15
Trade plan:
-bounce off DP pivot - 39.2 (overnight lows) , targets ~42.2
-target is top of a past gap that was filled recently, but too quickly. look for it to fill again
*plan void if open > pivot - PM lows
stop below pivot with low volume, watch tape


UBER MOST LIKELY TO BE "LONG"I believe we're just done with the correction that took around 10 months from February 2021.
this is my expectation of the path it would take.
Also, today it was upgraded to buy with a target of 80$ from UPS.
What do you think?


$UBER with a Bearish outlook following its earnings #Stocks The PEAD projected a Bearish outlook for $UBER after a Positive over reaction following its earnings release placing the stock in drift B.
If you would like to see the Drift for another stock please message us. Also click on the Like Button if this was useful and follow us or join us.

$UBER Close to volume shelf support. ABCD Downtrend pattern.After Head and Shoulder formation, the downtrend may be reversed in volume shelf support zone.


UBER Volume AnalysisSee arrows to indicates direction of the volume. Seems like this is a unfinished auctioned conclusion happening meaning the jump was too quick by an institution. They want to absorb all the supply every trading hours to complete their full position maybe ?
Green light with a (1.000) ratio are fibs projection forming potential support if we break the strongest one for now.
Waiting to see here if UBER will start to show some strength before entering anything. Any high RR play can be valid here.
I will be personally take a sub 15 delta play on this one for options.

UBER Bounce possibleI think this could be a black Friday sale on Uber.
I like the risk-reward for a bounce at these levels.
