unh knife catchI won't do anything with this, it's more for fun. Long term this could be a good buying opportunity. Usually Dow stocks respect monthly/quarterly levels. So if you're a dividend investor and willing to hold longer term, this could be a nice area.
UNHD trade ideas

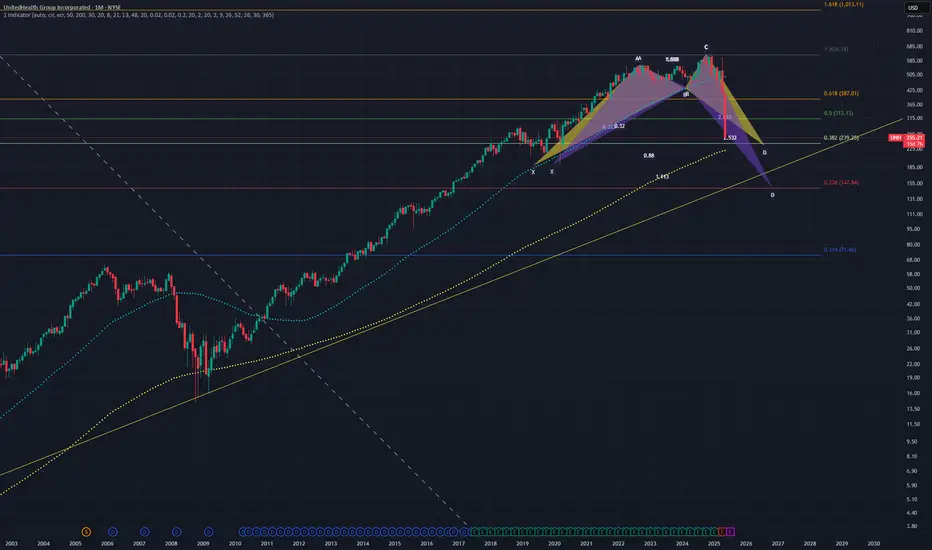
Where does the tumble stop for $UNHUNH has been in a free fall been absolute chaos for..reasons.
I see a possible Shark. Sharks can complete at the 886 or the 113. This happens to be around the 236 and 382 of the Macro fib retracement. We also have the 200 Monthly SMA.
So where does it stop tumbling? The 236, the 382 or the 200 Monthly SMA? I am betting it goes to the 236 and bounces sometime around earnings. Notice that trendline that goes back to 1998 that acts as support. I am betting it bounces around where the trendline and 236 intersect sometime around the next earnings. That's a good spot to go long.
UnitedHealth Group faces DOJ criminal probeUnitedHealth Group faces DOJ criminal probe amid stock turmoil. Will the gaps be filled? (and most importantly when)
This situation shows the critical importance of compliance and transparency in the healthcare industry, especially for companies managing public funds.
UnitedHealth Group is under a criminal investigation by the U.S. Department of Justice for potential Medicare fraud, as reported by the Wall Street Journal. This follows a civil inquiry earlier this year and a separate Senate investigation into the company's Medicare billing practices.
The company's stock has experienced significant volatility, recently closing at $308.01, marking a 48% decline over the past month and a 40% drop year-over-year. Analysts have adjusted their outlooks accordingly, with Oppenheimer setting a price target of $400, KeyBanc at $450, and B of A Securities at $350.
#trading #tradingcards #tradingstrategy #daytrading #swingtrading #stocktrading #optionstrading

Now what do you do with UNH ?For me, it is a screaming buy. Hear me out.
This was in my watch list for a while but I never get a chance to go long as the price keeps climbing up or my funds were tied up with other shares/ETFs, etc.
A 50% fall from the peak but what is more important is the parabolic move down, almost 5 straight weeks of 90 degrees plunge down. The sell down seems pretty serious and by any metric you used, it is way oversold and begs for a reversal.
However, on the daily chart, it is still RED which means the selling is not done yet and we could probably see more sell down days ahead to 196-279 price level.
So, I will be watching it closely this time and be ready to nibble some when it falls further.
Healthcare stocks seem to be battered in this sector rotation round so get ready your ammunition , the reversal could come sooner than later........

UNH and DOJ. What has ever happened? Value stock Back with another freebie for the followers. I am not getting enough love after the freebies and multibaggers I have thrown at the community.
UNH. Investigations, fraud, malpractices.
Does that change the fact that it is the biggest health insurer in the USA? People reading this might be insured with UNH.
What have investigations ever brought the USA?
A slap on the wrist, a fine and some low key employee fired. Does that change your insurance? Does that wipe out 100+ billion from UNH balance sheet? NO
A value stock for a value investor.
The Foxx announces a position of 10000 stocks of UNH @284.1 post market 19:35 on May 14 2025. Happy to average down till it goes to 1. That is conviction. Bill ackman who?
Follow the Foxx, throw some love in the comments, and ill maybe throw another bone for yall soon..


UnitedHealth UNH - Institutional Exit or Long-Term Opportunity?Key Insights
UNH has witnessed a historic -24% monthly drop, breaking multiple key long-term supports on extreme volume — often a sign of institutional distribution or capitulation.
Bearish Outlook (Primary Bias):
Current price is testing the 0.5 Fibonacci retracement ($322 - $287), a critical make-or-break zone.
A monthly close below $287 will likely trigger the next leg lower toward $250 and possibly the $200 psychological handle.
The bearish momentum remains dominant, confirmed by RSI deep in bear territory and MACD accelerating down.
Invalidation Levels (For Shorts):
Aggressive short invalidation: Weekly close above $395.33.
Full bearish invalidation (shift to bullish bias): Monthly close above $447.21.
Bullish Opportunity Zones:
Watch for strong bullish reversal at the $287 - $249 support zone, aligning with 0.382 Fib and historical demand.
If $200 - $160 is ever reached, it becomes a high-probability accumulation zone for long-term investors.
Probability:
$395 - $447 Strong Short Bias , Look for retests & rejection
$322 - $287 Neutral to Bearish (watch reaction), Currently testing key support
$249 - $200 High-Probability Long Setup, Look for confirmation reversal
Above $447.21 Bullish Bias Resumes, Invalidate bears, shift to longs
Conclusion:
UNH is at a critical long-term support crossroad.
Patience is key—traders should avoid chasing the lows and wait for higher-probability setups at key levels.
Let the chart guide the trade

UNH next strong Support $286As of May 13, 2025, UnitedHealth Group (UNH) stock is experiencing significant volatility due to recent corporate developments:
📉 Current Stock Performance
Price: Around $337.02 in premarket trading, down approximately 11% 1.
Previous Close: $380.72 2.
📰 Key News
CEO Change: Andrew Witty has resigned as CEO for personal reasons. Stephen Hemsley, former CEO (2006–2017), has returned to the role.
2025 Guidance Suspended: UnitedHealth has suspended its 2025 financial outlook due to higher-than-expected Medicare Advantage costs and increased care activity 1.
📊 Analyst Outlook
Consensus Rating: Moderate Buy based on 24 analyst ratings.
Average Price Target: $596.86, suggesting a potential 56.77% upside from the previous close 2.
Price Target Range: $490 to $700.
Would you like a chart of UNH’s recent stock performance or a breakdown of analyst ratings over time?

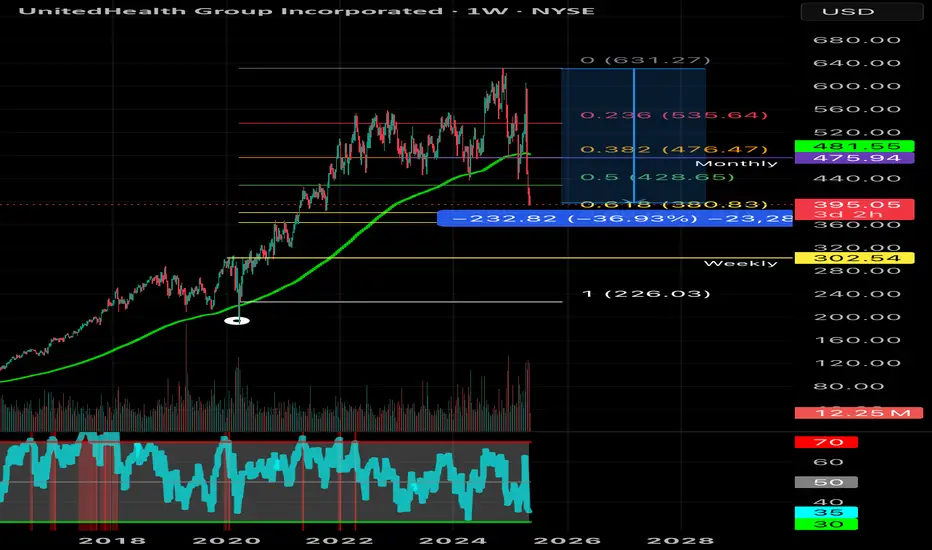
UNH: Knife or Generational Opportunity?News today that NYSE:UNH suspended 2025 guidance and CEO stepped down led to a massive route... right down to the 50% Retracement from the 2008 bottom to the former All Time High.
This is potentially a big opportunity for a long term position at this level: 322. I would have preferred the level to be matched by a Volume Profile level but the nearest one below is at 244. I can still see a good risk adjusted trade back to the median of the down move initially and onward to a full recovery.
I took a moderate position in tax advantaged accounts for the long term hold and will keep an eye on this level for a more tactical setup (a spike or further price action to confirm the hold).

UnitedHealth: Reversal incoming?UnitedHealth: The UNH stock is undergoing a correction phase, with the possibility of further declines into the - support zone. This level is marked as a strong long-term buy opportunity for investors, and price recovery is expected from this zone. Should this correction unfold as anticipated, the stock could rally to and beyond, with potential targets at and in the longer term.
Thank you for taking the time to read my analysis.
I look forward to reading your thoughts.
Best regards,
Mattner

UNH....OVERSOLD......REVERSAL SOON?UNH testing third support touch at ~$394, with RSI near 30 on the weekly, signaling potential oversold conditions. Despite a tough Q1 with 4% EPS growth and rising medical costs, UNH boasts 10% revenue growth, a 2.08% dividend yield, and a massive 51M member base. Is this a dip to buy?

Cash printing machine on saleFor all the hatred UNH gets, this company is looking like a buy after this huge sell off. We are approaching the golden ratio around $380. The company generates $100bn in revenue per quarter, hence why it’s a highly regarded cash printing machine.
The bearishness may continue as we sit below the 200week MA. I have a worst case scenario of $300 where we have a strong weekly level of support. I think we’ll bottom closer to the mid $300s so I’ll be taking a nibble with a longer term view on this stock.
Not financial advice
Potential buying opportunity on UNH!OptionsMastery:
🔉Sound on!🔉
📣Make sure to watch fullscreen!📣
Thank you as always for watching my videos. I hope that you learned something very educational! Please feel free to like, share, and comment on this post. Remember only risk what you are willing to lose. Trading is very risky but it can change your life!

UNH close to pivotUNH finds itself right on the 100 monthly EMA which is an insane moving average to touch. The stock has also corrected into the golden pocket between the .5-.618 fib which is one of my favorite setups especially on weekly plus timeframes. The last time advanced stochastic was this low was the 2008 financial crisis.
Net long here, would love 375 but as this is a monthly chart the buy signal is now

$UNH Rinse & Repeat Round #2- Fundamentally it's undervalued for the quality blue chip company. My detailed analysis is on the older post I made earlier this year. I have attached that as a reference.
- In my previous swing, I bought NYSE:UNH on a sell off @ 441 and sold @600 before earning as a de-risking strategy. I'm glad that it did work out.
- I'm happy that NYSE:UNH is again trading at a discount and with compressed Earning multiple. This time I am buying it even lower than where I bought last time i.e 441 and I was happy with that price average.
- Whereas I do believe that NYSE:UNH EPS is lowered but it is lowered slightly which doesn't warrant a big sell off like this.
- I wanted to wait further before entering but I can't stop myself from buying this name NYSE:UNH at a price where I believe it's very undervalued.
- Therefore, I have re-entered the NYSE:UNH and added it to my portfolio . I will consider adding further if selling pressure continues because I don't want to time the bottom.
- But undecisive market and lumpy market, going with a defensive name like this is a no brainer.

UNH: $250 18x in 10 years health is an investment
invest in a company that is dominating across the universe and setting up shops in emerging markets

UNH Long $400 - Wyckoff Re-Accumulation SchematicWyckoff Re-Accumulation on UNH after recent ER sell off. Look for $400 to be supportive. Potentially an excellent addition the long term portfolio.
NYSE:UNH

UNH eyes on $579.28: Genesis fib for possible bullish supportUNH testing a Genesis fib at $579.28.
This might get a decent bounce here.
Ultra-Bull if breaks Golden at $592.60.

Trading idea: Buying at $396 and selling at $483Trading idea: Buying at $396 and selling at $483.
Just a trade my friend.

UNH Sitting on supportThis level shows a major support level with all the rejections. Currently I’m seeing a falling wedge the broke the trend line (not the previous lower high)resistance last month and is currently retesting that line. More or less with the last 2 consolidations price had to move sideways in the channel for a continuation of a healthy up move. We may see a short term down from here but expect price to close at the $505 level eom. I’m in at $450.15.

UnitedHealth (UNH) Share Price PlummetsUnitedHealth (UNH) Share Price Plummets
UnitedHealth shares crashed by nearly 23% yesterday after the healthcare giant reported weaker-than-expected Q1 2025 results:
→ Earnings per share: actual = $7.20, expected = $7.29
→ Revenue: actual = $109.5bn, expected = $111.5bn
Technical Analysis of UNH Share Chart
As far back as a year ago, we highlighted key support around the $450 level. Yesterday’s negative news caused this support to once again demonstrate its strength by holding back further decline — but will it hold?
Taking the price action marked on the chart as a base, we can establish the structure of a descending channel (shown in red), with the price gapping sharply lower into the bottom half of this channel — and yesterday’s candle high (marked with an arrow) suggests that the median line has turned into resistance.
Yesterday’s candle closed near its lows, so it is reasonable to assume that bearish pressure may persist (with the aim of testing the lower boundary) — in which case, the $450 support zone, in place since early 2022, could be at risk.
This article represents the opinion of the Companies operating under the FXOpen brand only. It is not to be construed as an offer, solicitation, or recommendation with respect to products and services provided by the Companies operating under the FXOpen brand, nor is it to be considered financial advice.

$UNH buy the fear or sell into narrative?- NYSE:UNH has gotten into trouble with bad headlines after bad headlines.
- Recent DOJ probe led to 12% shaving in the stock price.
- Could it be a buying opportunity or just a falling knife?
- Are you afraid that NYSE:UNH could become NYSE:HUM 2.0?
Let's talk about fundamentals!
Year | 2024 | 2025 | 2026 | 2027 | 2028
GAAP EPS | 15.76. | 28.22 | 32.11 | 36.80 | 41.11
EPS growth% | -33.47% | 79.08% | 13.77% | 14.61% | 11.71%
It appears that 2024/ Early 2025 was the year when EPS growth bottomed and would go from negative to positive back again.
EPS growth is healthy double digit in mid teens. A fair forward p/e multiple for mid teen EPS growth should at least be 15 ( conservatively )
Year | 2024 | 2025 | 2026 | 2027 | 2028
Fair Stock Price (w/ forward p/e = 15 ) | $236 | $423 | $481 | $552 | $616
However, NYSE:UNH is a blue chip company and has a moat. Therefore, Investors will be willing to pay forward p/e of 20 once negative news subside.
Year | 2024 | 2025 | 2026 | 2027 | 2028
Fair Stock Price (w/ forward p/e = 20 ) | $315 | $564 | $642 | $736 | $822.2
Final Take:
I'm a buyer of NYSE:UNH < 450 will add more if it dips below 400 for the long term. Good quality companies don't usually buyers to get their skin into the game. Therefore, it's better to buy the fear than selling into narrative.

UNH: Corrective wave coming to an endAfter the steep selloff for UNH, it has seen a significant bounce to the previous resistance level - this was aided by the fact that UNH because a popular tarriff counter trade, with money pouring in to what has been considered a safe haven in times of trade war turbulence. There space to run some more but its likely that UNH will run out of steam soon and retest support levels at ~480 and ~450.
