Visa (V) still has momentum to move up?Visa is a stock that pays dividend and mainly in the credit card industry. It has rapidly moved in various digital payment gateway and is widely accepted. This stock hit 52 weeks high and all time high on 29 April at $237.50. It is now moving in a range of $228-$237.50.
Should the price stays above $228, it could break above the all time high. The nearest support would be at $220.
VD trade ideas

Visa Wedge (Short it)Broke through support and fell all the way to the 50 ma and bounced. Tomorrow it will cut through that 50 and tank.
First target 219
Second target 200ma at 212.
If it falls through there we could see 160 (Seriously)

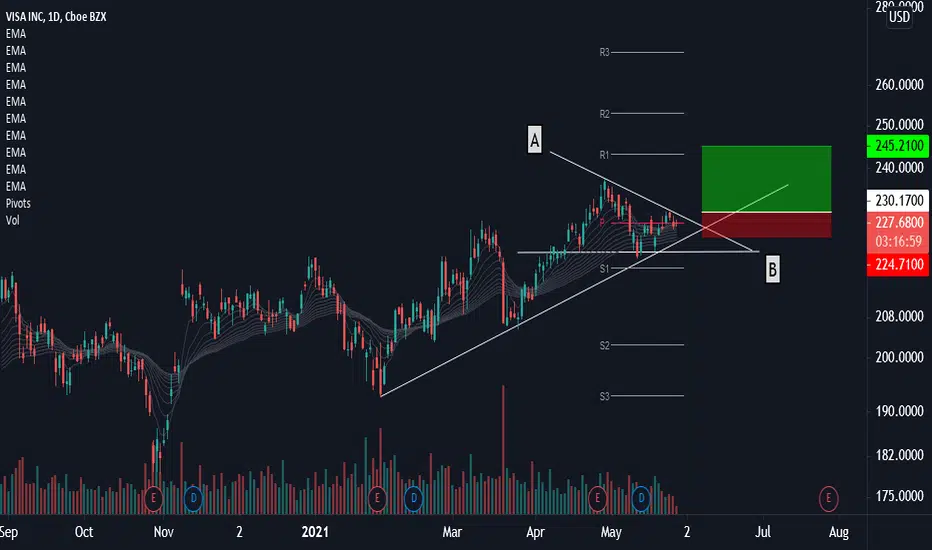
Technical Trade Setup: Visa Inc (V)Buy/Long on a break above line A-B or above $230
Stop-loss: $224.70
Target Range: $244-247
Type: Swing
Higher spend of money caused by Inflation? Higher Intrest rates?Higher spend of money caused by Inflation? Higher Intrest rates?
The winner is VISA! They earn money when people spend more money and surley profit from higher interest rates.
VISA should trending for longer time upwards and be a safe habor right now, to put some money in it?
VISA assumes a higher spending: usa.visa.com


Visa: Study of W Bottom potential Visa: Study of W Bottom potential: A bullish indicator called the W Bottom or Double Bottom could clue in to a move to the upside

Daily Analysis on VISA / Inside an ascending channelToday, we will take a look at Visa.
- The main aspect we can see is the ascending channel as the main bullish structure
- The second item we see on the chart is the dynamic support resistance zone that has been tested several times from above and below
- Currently, we observe a corrective structure that tends to behave as a continuation pattern after the breakout.
- Based on all the previous items. If the price reaches the green line, we will consider it an activation level for this view. Final Target the higher trendline of the ascending channel
- The expected duration for this movement if the price reaches the green line is between 30 and 50 days.

Bull Flag Pattern on $V$V looks like its gonna continue the uptrend, what I like here is that price came back down & retested that 220 - 222 range & caught a bounce on support. Although the Stochastic & RSI aren't as erect as they can be, they're both assuming a bullish posture. Price is currently testing the 9 EMA & 21 EMA at that resistance level. Further, imo its $5.11 or 2.25% til price is at $232.09, the second profit take is the monthly high of $237.17, & that's $10.73 or 4.73% away.
IV RANK is 14.2 %
the BETA is .99%
PATTERNS ARE ONLY A LIKELIHOOD THAT THE TRADE WILL WORK
-Mark Douglas
let me know how yall liked the TA thanks.

Visa Looking Good-Visa has been trading in a tight upward channel since January 2021.
- Strong Possibility of reaching the 2 year Resistance Line before June.
This is not investment advice, just my personal investment idea.

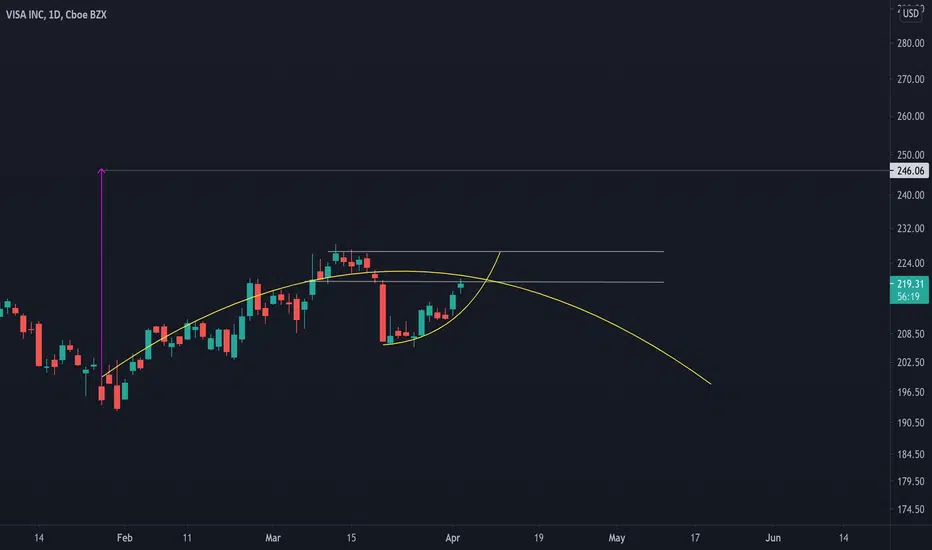
Visa Has Pulled BackCredit-card giant Visa is an interesting stock. Officially, it’s a member of Technology. But it’s also cyclical because of its obvious connection to spending and the financial sector.
Not surprisingly, V broke out to new highs in late April as the economy moved closer to reopening. Quarterly results beat consensus and business trends for the current period were strong.
V peaked at $237.50 following the news. It then ran out energy and dove back toward $220. That’s an interesting level because it’s near a peak from the end of last year.
Two other patterns stand out. First is a trend line running along the lows of late January and late March. Second is the 50-day simple moving average (SMA).
Third, notice how stochastics have dipped back to an oversold level.
It’s a pretty recognizable setup overall with trend, levels and macro conditions all potentially lining up for the bulls.
TradeStation is a pioneer in the trading industry, providing access to stocks, options, futures and cryptocurrencies. See our Overview for more.

V Trade IdeaI have 4 possible entry and scenarios to play on V. Once it hits my entry zones, indicators should confirm strong bullish sentiment for me to entry.

Traditional|V|Long *H.rLong V
Activation of the transaction only when the blue zone is fixed/broken.
The author recommends the use of anchoring fixed the blue zone, this variation is less risky.
If there is increased volatility in the market and the price is held for more than 2-3 minutes behind the activation zone after the breakdown, then the activation of the idea occurs at the prices behind the activation zone.
The idea is to work out the resistance level .
* Possible closing of a trade before reaching the take/stop zone. The author can close the deal for subjective reasons, this does not completely cancel the idea and is not a call to the same action, you can continue working out the idea according to your data, but without the support of the author.
+ Maybe right now we will go even lower, then it's okay, the idea is not activated and simply canceled.
+ ! - zone highlighted by the ellipse is a zone of increased resistance, in this area there is a possible reversal for a correction, please take this factor into account in this transaction.
The "forecast" tool is used for more noticeable display of % (for the place of the usual % scale) of the price change, I do not put the date and time of the transaction, only %.
Blue zones - activation zones.
Green zones - take zones.
The red zone - stop zone (L-SL 1 first stop zone, L-SL 2 second stop zone) the author provides for the closure of the L-SL2 stop, but you can use the L-SL1 zone at your own risk.
Working out the stop when the price returns to the level after activation + fixing in the red zone.
Orange arrow - the direction of take.
Black arrow - neutral scenario without activating the trade.
The red arrow - the direction of the stop.
SUM PNL: This parameter displays the total % of all closed ideas of the "new" format (according to the author) for this sector at the time of publication of the idea. The calculation is very "clumsy" just the sum of the profits of all the ideas, based on this indicator, you can more accurately assess the risks when working with my ideas of this sector. I present you the construction of the idea, you can use it yourself as you like based on your subjective view and risks, the calculation of the PNL indicator is carried out only on transactions that the author closed on TV in manual mode or by take.
P.S Please use RM (risk management) and MM (money management) if you decide to use my ideas, there will always be unprofitable ideas, this will definitely happen, the goal of the system is that there will be more profitable ideas at a distance.

(V) Visa - Trend-line Analysis Visa has had an ascending trend line with 3+ indicators, if a potential pullback occurs back down past resistance then a bullish upside with form bringing it back out above the resistance line and break through for a fair gain. RSI & MACD indicates good volume and buyers interest. Meanwhile the Visa has stayed above its 30 week MA during this trend line.

(V) Visa - Trend Line ObservationThis analysis for Visa is going off a 3+ touch ascending trend line, with a potential mild pullback back under resistance line followed but a breakout. If volume allows this could see some gain on the upside.
RSI & MACD are showing decent bullish signs. Thought this would be a worthy share.


quick trade into earningsloaded up near a support level pre earnings today; primarily on a hunch that they'd do well on the back of stimulus & reopening spend activity, also because the stock is UNCH for over 400 days & recently breaking out, so my thesis this breakout is warranted despite a 49x P/E. I'm in this trade until PT ~$250ish & no later than May 19, I think it'll fail before reaching resistance at around $262, if it touches 260+, I'm a monkey's uncle and selling hard there. The market is due for a correction, so pragmatism tells me I'll likely slap a trailing stop on this. Otherwise, it was positive earnings reaction, in the green on this, consumers are still buying crap, and payment processors are a better play than AMZN & Walmart. Although I do think WMT is a fair bullish trade assuming the complex hovers into its earning. My .02...

Visa ShortJust off the technicals, it seems like a formation of a double top. Volume is starting to decrease. We can see it falling back to the 206 level displayed on the chart

Visa - Continue to Go UP ?Greetings
Humbled, we would like to thanks for your support who has already liked, commented and followed us. Your support, strengthens us, to help in analyzing the market. If you have any questions, feel free to send us message (inbox).
Pra Trading :
- Please care for Money Management
- Have a good psychology
- Do not be hurry to open position and do not do nothing if u see opportunity
- Evaluate and upgrade your trading plan
Execution Strategy :
- Know what you want to buy, see the Fundamental
- Decide that you are on investing or speculating
- Consider what your strategy based on Investing/Speculating
- Make Road Map Of Your Trading Plan
- Decide
a. Entry strategy
b. Cut loss
c. Target of Profit
Post Trading :
a. Do not be sad if you loss or do not be very happy if you win
b. Just become a normal without emotion, Do not put emotion into your trading
c. Evaluate your trading
d. Keep on Learning
e. Be Humble
Idea :
Visa - Continue to Go UP ?


Time to pay those credit card bills . Bullish divergence . Put a stop at 199.5 and make yourself some good 2 to 3 % profit boys


Anti-competitive allegation (boo) - $235+ target 2021 (yay)What a juicy entry into Visa.
I have worked closely with Visa, and these are some of the big points I think will work in their favour:
> Right where the stock was before the pandemic crash in March 2020. What?
> Olympic year -- Olympic years are good years for VISA as a TOP partner of the International Olympic Committee. Sure, we are a bit worried about how will the Olympics really look this year -- things seem a bit messy in Japan, but, if Japan can somehow get it together with the vaccines and protocol in time for the Games allowing some tourists in, this could be a good year with definitely stronger anticipated earnings for Sept/Oct earnings call.
> Travel and spend -- VISA's main revenue source isn't your domestic spend. Sure, the pandemic has perhaps even surprised VISA, as they reported positive earnings with online transactions and local spend -- but once those boarders open, the spend during international travel is where the bulk of the revenue will emerge from. I feel (and I could be wrong as who knows how safe management wants to play it) -- VISA will have fairly positive guidance during the May earnings report, which will be a big catalyst for the stock to jump and set all-time-high. If not then, I would still hold a position for 2021, because as things get better and people travel, they carry Visa in their pocket.
> Cryptos 'r' us + Dividend -- Few months ago VISA announced a Bitcoin based loyalty points program as a new product in select markets. VISA doesn't go "all in", but that's why I like VISA as a less risky yet growth-like stock. It can make strong moves upward, but, also keeps paying a tasty dividend.
I had de-risked by taking profits on VISA a few weeks ago. I did miss most of the rally we saw last week, but profit is profit and they still paid me the dividend. I have been looking for a re-entry when I felt the stock cools and a pattern becomes more obvious.
BUT WAIT...
While this dip is super tempting, I am not going all in just yet. VISA dropped so sharp on allegations of anticompetitive practices, as the department of justice investigates claims that VISA channeled transactions over their own (more expensive) networks for retailers, rather than giving them options to transfer through other networks (which is their legal right and possibly cheaper). What this means is that investors don't like the shock, and decided to take profits. What I will watch for is how the narrative develops over the coming week. If the market is generally recovering and the VISA news has no major follow up, great. If there is more news, we could even get down to $190s. I don't expect the stock to break that support.
Good luck traders!
