VZ // Double bottom at Fib. tested supportVZ is making a double bottom within the designated channel. Using Fibonacci Retracement levels, we see the support at $53.5, seems to align well with the 38.2% level.
Because the 61.8% level was broken, I expect the path of least resistance to be higher.
VZ trade ideas

VZ PutWe're just super bearish at this point and are looking at VZ as our next victim.
Short term drop down to peak COVID levels. Panic is sinking in and these in-person stores will be the first to go.
With Apple already closing stores in hotspots around the country, would Verizon follow suit?
We're also at our support and thus could bounce back up.

VZ, Trading In Triangle, Possible Opportunity On The Short-Side!Hello Traders Investors And Community, welcome to this analysis where we are looking at the recent events, the current price-structure and what we can expect the next times from VZ which is a company in the communication industry that is sending some interesting signals at the moment which can be measured with a trade on the short-side when confirmed. The stock is a well-known stock agitating in the communication industry since the Millenium crash in 2000 and had some first startings within the new glass fiber technology that should be expanded in many areas, besides that we see a consolidation since the corona-crisis where VZ does not really show a direction or strength to the upside this makes the whole environment certainly more bearish as it shows weaker signs as the rest market which is near its all-time-highs or already above them, therefore, we are looking at the 4-hour local's timeframe.
When looking at my chart you can watch that the stock is building up this massive huge triangle formation with the lows established after the corona-breakdowns and now consolidating in this huge wide range which you can see marked in the blue trend lines. The fact that VZ is consolidating below the 500-EMA which you can see marked in my chart in black makes the consolidation more bearish than bullish at all where we have other stocks that sending bullish signals above the 500-EMA this fact makes the stock more bearish right now. Also, we have the consolidation of the 100- and 30-EMA you can watch marked in orange and green within my chart which is confirming the triangle and the stock confirmed most of the time below these EMAs, therefore, the overall triangle which is forming currently is within a high possible spectrum a bearish triangle that can confirm to the downside and activate targets when confirmed.
The next hours and days we can expect the stock to complete its wave count it is forming with the final wave E at the bearish-confluence resistance you can see marked in my chart in red, this final wave of the major wave count will complete the triangle when confirmed with high volatility below the lower boundary of the triangle, remember that this has to happen with the proper high volatile breakdown a mere piercing of this line or a breakout and back up again can signal a fake breakout and therefore a bear-trap. This scenario can be traded rightly on the short-side when it confirmed with an immediate entry after the breakout which is really aggressive in this case or entry after the lower boundary has confirmed with a pull-back which should be the smarter option in this case, although both scenarios are possible traders should decide accordingly to individual risk-preferences.
We saw a big amount of the stock-market last weeks recovering the losses established with the corona-breakdowns and providing a pull-back and some uptrends but we should keep in mind that although this looks bullish at the moment it can still be a huge bull-trap as the real economy has really in no solid means recovered successfully from the breakdowns seen this year. In comparison with VZ an increase of bearish pressure in the whole other market and in leading indices like the S&P or NASDAQ can expand the possibility for bearish continuation in this stock. We need to elevate and look at how the situation is developing but as there are only marginal fundamental factors providing the bullishness of the whole other market beside the fresh money flowing into the market we should keep an eye of possible bearish continuation to the downside to trade the right direction and profit from the right outcomes.
In this manner, thank you for watching, support for more market insights and all the best!
Sometimes opportunities are hidden in the modern markets like unmined gold.
Information provided is only educational and should not be used to take action in the markets.

$VZ can fall in the next daysContextual immersion trading strategy idea.
Verizon Communications has a strong downside trend.
This and other conditions can cause a fall in the share price in the next days.
So I opened a short position from $49,71;
Information about stop-loss and take-profits will be later.
Do not view this idea as a recommendation for trading or investing. It is published only to introduce my own vision.
Always do your own analysis before making deals. When you use any materials, do not rely on blind trust.
You should remember that isolated deals do not give systematic profit, so trade/invest using a developed strategy.
If you like my content, you can subscribe to the news and receive my fresh ideas.
Thanks for being with me!


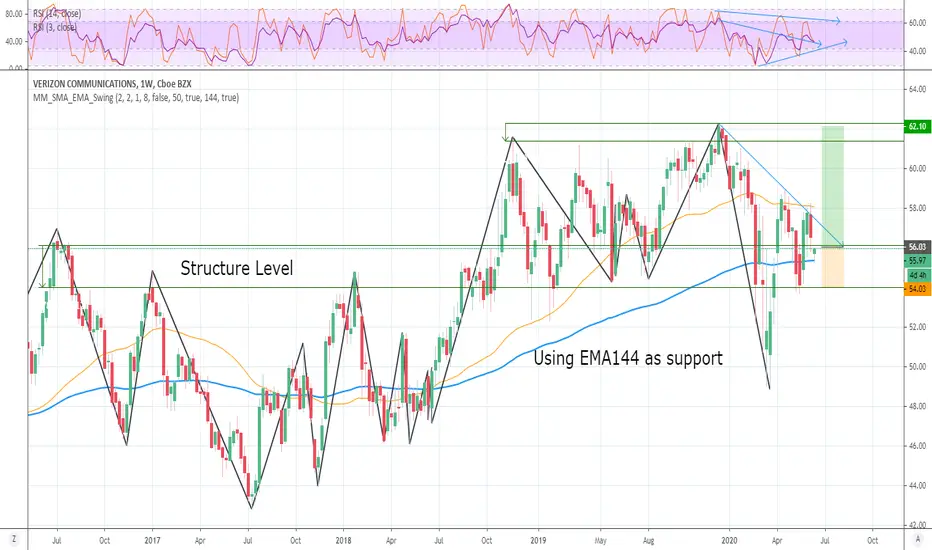
VZ Long, Using EMA144 as support Using EMA144 as support
Entry: 56
Stop: 54; Below EMA144
Target: 62; risk/reward=1:3
This is a trading school homework. I need few months to practice trading plan.
If you like it, thank you for your support. Please use SIM/Demo account to try it, until my trading plans get high winning rate.

VZ - Verizon communication s/r zonesHello traders,
Description of the analysis:
Verizon s/r zones, gray supports are good for investment. Trade what you understand, trade carefully and sparingly according to the business plan.
About me:
Hi, my name is Jacob Kovarik and I´m trading on stock exchange since 2008. I started with a capital of 3000 USD. My first strategy was based on OTM options. (American stock index and their ETF ). I´ve learnt on my path that professional trading is based on two main fundaments which have to complement each other, to make a bussiness attitude profitable. I´ve tried a lot of techniques and many manners how to analyze the market. From basic technical analysis to fundamental analysis of single title. My analytics gradually changed into professional attitude. I work with logical advantages of stock exchange (return of value back to average, volume , expected volatility , advantage of high stop-loss, the breakdown of time in options, statistics and cosistent thorough control of risk). At the moment, my main target is ITM on SPM index. Biggest part of my current bussiness activity comes from e mini futures (NQ, ES). I´m trader of positions. I´m from Czech republic and I take care of a private fund ($4.000.000 USD). During my career I´ve earned a lot of valuable experience, such as functionality of strategies and what is more important, control of emotions. Professional trading is, in my opinion, certain kind of mental training and if we are able to control our emotions, accomplishment will show up. I will share with you my analysis and trades on my profile. I wish to all of you successul trades.
Jacob


Verizone (VZ) Weekly Chart.
Technicals
Verizon Communications (VZ) bounced nicely off ascending trend line support this week and 200 weekly moving average at (1). Now testing resistance at 55.05. We need to hold above resistance before further upside can take place. Below trend line support negates this bullish outlook.
Fundamentals
Pros
Trading at 50.3% below its fair value.
Earnings are forecast to grow 3.65% per year.
Earnings grew by 24.1% over the past year.
Pays a high and reliable dividend of 4.49%
No significant price volatility in the past 3 months.
VZ is good value based on its PE ratio compared to the Telecom industry average.
VZ’s return on equity (ROE) is forecast to be high in 3 years time (26.4%)
13.4% annual earnings growth over the past 5 years.
VZ’s current net profit margins (14.6%) are higher than last year (11.9%)
Earnings have grown by 13.4% per year over the past 5 years.
VZ’S insiders have bought more shares than they have sold in the past 3 months.
Cons
Has a high level of debt.
-6.4% return over the past year.
VZ is poor value based on its price to earnings ratio.
Earnings are forecast to grow slower than the US market.
Revenue (1.4%) is forecast to grow slower than 20% per year.
VZ’s short term assets do not cover its short or long term liabilities.
VZ has a high level of physical assets or inventory.
Debt is not covered by short term assets.
Sentiment has become very optimistic, which can result in a decline in prices.


