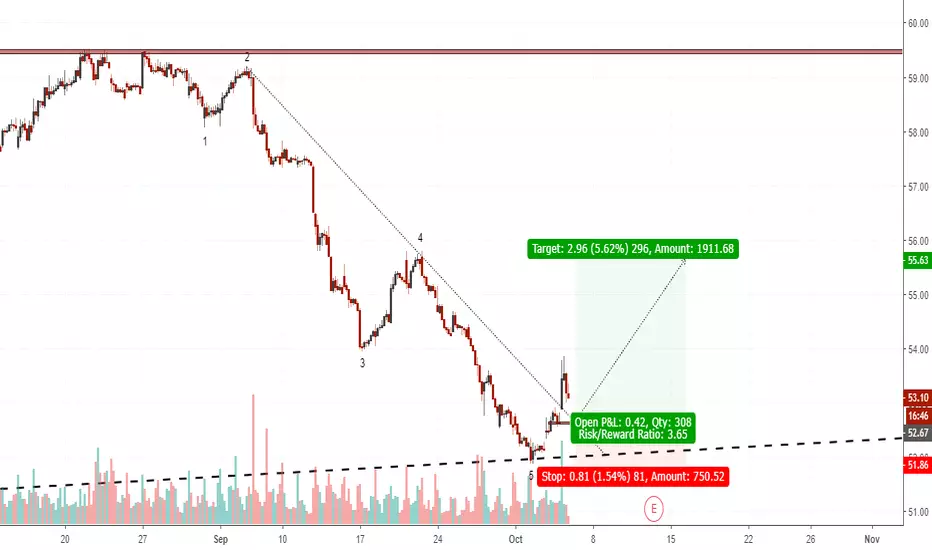
WFC POTENTIAL DOWNTREND CONTINUATIONWFC has broken the long term correction with a strong impulse. I'm expecting a downtrend continuation to complete a potential 3 wave pattern.
WFC trade ideas


Well Fargo to drop to $38?Wells Fargo created an HVF pattern starting from around the year 2009 leading up to about 2012. It broke out of the funnel, hitting both targets nicely.
It hit perfectly at the main target for its ATH (creating the head for the H&S pattern) then dropping right back down. It is seeming to come to a finish on the H&S pattern and if it breaks the neckline, we could potentially see targets to about $38 or more (about 28% profit from the neckline).
Lets see how this plays out over time. Keep in mind this might take some time to hit its targets considering that this is a weekly graph

WFC - up to 30% room upwards before mean reversion is dueSolid fundamentals and healthy upward trend, which is expected to drive stock prices up to 30% higher.
After reaching top end of the channel a significant pullback may happen.

short WFCWFC should enter correction mode dragging with it the banks
Frist tgt: 52.70
Second tgt: 44.20

WELLS FARGO & COMPANY (WFC) - NASDAQ - Drop - xuanhaimmoerWe are in panic sell in middle term
The price break uptrend channel and built bearish flag pattern
TD - Sequential: reveal 9 red candles so we may have small up correction
Ichimoku: the price drop below the cloud and break pattern >>> test the break out in Fibo 0.38
DMI 4c: We have strong downtrend when ADX over 20 and (DI+) - (Di-) < 0
The target for this stock after up correction in the chart and all you can follow this.
Thank for reading and hope you like this analysis


WELLS FARGO going strongWells still looks well poised for higher highs. US banks seem to be on a bullish run, so investors and traders might be trying to catch a bargain with this one.

WFC monthly channel bounceXLF is at the bottom of a daily channel and bouncing. This coincides with WFC at the bottom of a monthly channel. Long WFC stock at 52. Long WFC 10/19/2018 52.50 calls at 2.75 and also at 3.00. Looking for a bounce to the middle of the channel.

Good to buy with retested CUP - HANDLE pattern and ABC waveMy strategy: I used many techniques in my analysis with
- Price Action is a trading technique that allows me to read the market and make subjective trading decisions based on the recent and actual price movements.
- Price Channel is a pair of parallel trend lines that form a chart pattern for a stock or commodity. Channels may be horizontal, ascending or descending. When prices pass through and stay through a trendline representing support or resistance.
- Elliott Wave is a form of technical analysis that finance I use to analyze financial market cycles and forecast market trends by identifying extremes in investor psychology, highs and lows in prices, and other collective factors.
- Supply and Demand is a theory that explains the interaction between the supply of a resource and the demand for that resource. The theory defines the effect that the availability of a particular product and the desire (or demand) for that product has on its price. Generally, low supply and high demand increase price. In contrast, the greater the supply and the lower the demand, the price tends to fall.
- Support and Resistance are a critical part of trend analysis because it can be used to make specific trading decisions and identify when a trend is about to reverse.

#WFC ...guess what ...BULLISHwells fargo is moving up ….fundamentals are strong and we all know it … Feds will keep raising raising rates this year and next year … chart do show a nice setup also.


Uptrend for WFCGood time to buy WFC while it is bouncing around 200 MA. Broke down trendline. Watch hourly and daily for confirmation.


Wells Fargo's Resurgence (part 2)AT this aspect of the analysis will be straight forward because at this point, after studying the long-term trend (5-yr), we discerned that the price was trending up. After looking at the 1-yr chart my conviction hasn't been swayed although the price's trend is heading into a resistance cloud and 31.8% resistance level I feel there's enough momentum to break through them. At this point the long-term and mid-term perspectives look good the next will be to try to forecast the shorter-term prospective. BUT, I like the stock enough that I don't know that there's any more evidence from the price action to assuage me from further research. The last part of this analysis will be to do the fundamental analysis and understand the growth prospects of the company from within.
I'm not averse to doing the short term analysis, leave a comment if you'd like me to do it. Check my blog Ready Set Budget (readysetbudget.blogspot.com) for other aspects of financial planning.

Well Fargo's Resurgence (Part 1)This is the first part of my top down analysis of Wells Fargo which is looking to pick up the pieces from it's recent scandals. At this point of the analysis I'm working in reverse by looking at the trend before I look at the actual value of the company and it's financial position. The overall trend is upwards even though this year there was a massive retraction. BUT that retraction is just faced its bottom resistance (W- bottom) which look like the bottom of an upward trend. The price just jumped off the 200-day moving average (exponential) and is fixing to catch up to the 50-day moving average. The 50-day moving average is starting to turn up as well but the rate of change in volume is quite subdued, but the momentum is slowly turning.
Comments and positive criticism are always welcome!

WFC uptrend in progress It looks like a nice pattern here, it's going up gradually and then consolidating plenty of room for more gains. APRN is having the same type of pattern gains are being made from these 2 studs!

4 horsemen $JPM $BAC $C $WFChigher rates lower regulations #WINNING! those $XLF July 28+ calls will PAY in time.

WFC returning from down-underShould have spotted this one sooner, 53 would have been a great entry point. Now it's getting riskier to enter. 56.15 would be another resistance level for this one, if it surpasses it then clear gainz should occur up to 58.
