WFC trade ideas
WFC longPrice bouncing off from the wk demand imbalance, buy signal confirmed by slope of EMA and MACD. Buy in daily to catch up the uptrend

WELLSFARGO recoveryWellsFargo is constantly bombarded for its foul practises but its share price handled the backlash quite well. As a result of this underlying sentiment to support the share price being in congruence with the technicals, I think this provides a pretty good buy-side opportunity.
S/l: $43
T/p: $80

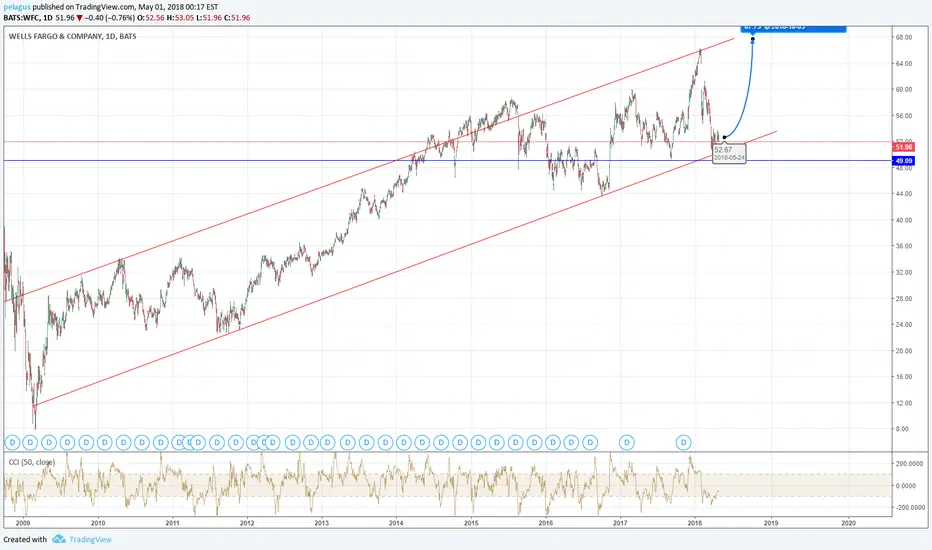
Wells Fargo is a buy at current levels ($51.55)WFC's stock price made a double bottom around $50-51. Retracement to $56 is highly probable (38% Fibonacci level from 66 to 51). The stock is down almost 20% in the past three months.1Q results were not that bad as it reported earnings of $1.12 per share beating estimates of $1.07.
With a forward P/E of 12-13x and a current P/BV of 1.4x, the stock appears cheap. The US Financial sector trades at a forward P/E of 20x or so. Dividend yield is decent at 3.1%.
I am buying the stock with a target of around $60.

Bull DivergenceThe start of a bullish divergence is starting to show on the stochs. This is powerful and could lead to a breakout of the downward wedge soon!

WFC long setupPotentially bouncing off major support. Feeler position at 52 and looking to add through 54


Classic AB=CD > Re Entry @ 51.30Price and Time: Under this type of ABCD pattern the amount of distance and the time it takes for price to travel from A to B is equal to the time and distance from C to D
Classic ABCD: In this pattern, the BC is a retracement of 61.8% – 78.6% of AB, with CD being the extension leg of 127.2% to 161.8% (equal in price distance)
ABCD extension: CD leg is an extension of AB between 127.2% – 161.8%

AB=CD, Crab, Bearish 5-0, RSI BAMM"The 5-0 pattern®, was discovered by Scott Carney and released in his book, Harmonic Trading of the Financial Markets: Volume Two.
Is a unique structure that possesses a precise alignment of Fibonacci ratios to validate the pattern. Although the 5-0 pattern® is considered a retracement pattern, as the 50% retracement is the most critical number within the Potential Reversal Zone, the measurements of the various price legs are slightly different than the Bat pattern™ or the Gartley™.
The 5-0 is within the family of 5-point harmonic reversal structures and is primarily defined by the structure’s B point – as is mandatory for all harmonic patterns™. However, the 5-0 pattern® requires a reciprocal AB=CD measurement to define the pattern’s completion.
The basic premise of the pattern is to identify distinct reactions following the completion of a contrary trend. Valid 5-0 patterns® typically represent the first pullback of a significant trend reversal. In many instances, the AB leg of the structure is a failed final wave of an extended trend.
The 5-0 is an incredibly precise pattern that possesses only two numbers – the 50% retracement of the BC leg and the Reciprocal AB=CD Pattern™ " - Scott Carney

Bullish Crab PatternThe key characteristics used to identify the Harmonic Crab pattern are as follows:
AB leg can retrace anywhere between 38.2% up to 88.6%
BC can retrace 38.2% – 88.6% of AB leg
CD is an extension of up to 161.8% of XA leg and is also an extension of 224% – 316% of the AB leg
After the crab pattern is established, traders can take their positions at or from point D (at the high or at the low of the price bar at D) targeting 61.8% and 127.2% of CD leg.

WELLS FARGO CORP. (WFC) DAILY BULLISH BUTTERFLYWELLS FARGO CORP. (WFC) DAILY BULLISH BUTTERFLY TGS 56.84 AND/OR 60.45

WFC Long Opportunity Higher High created, now we are seeing a pullback.
My long-term target for this stock is $64.00


Wells FargoVeo escenario de compra en WFC.
Viendo que esta en pleno retroceso, considero buena entrada a niveles de $53 usd de acuerdo a niveles clave de Fibonacci y un objetivo de $70 usd... la tendencia principal es alcista así que espero la idea se desarrolle bien.
El análisis lo hice en gráfico D1.


You Can't Grow Hi guys. Well, this one was supposedly officially told it can't grow. Will it obey? I have no idea but it looks weak and just broke the top range. Have a nice day and thank you very much indeed imho.


12.3.17 | WFC | Day | Andrew AponasJournal Entry: I think I may see a possible retracement from the bullish wave. A double bottom or Big W had just completed it's formation and price is now testing a supply zone which may follow up with a slight response bearish consolidating just below the zone in a downward motion. I expect price to stay pivot at support which is overlapping the 50% line. Both days traded on above average volume signaling that this may be stopping volume or the insiders are keeping the market propped up at this level prepared to move it higher. Based on both indicators I am using they are tracking bearish divergence on the upward moving channel price is trading in and has been trading in for the past few months. Thank You, God Bless.
Indicators:
RSI is tracking bearish divergence in a downward moving channel I have drawn in a pivot point right below the RSI line and expect a pivot here if price is going to go long. I also drew a trendline for a breakpoint signal in the event that price continues bearish.
OBV is also tracking bearish divergence with a possible triangle overlapping the downward moving channel. This may begin to signal a breakout as price squeezes out if the triangle pattern is proven to be true. I also have the 50EMA overlapping this indicator and the OBV is confirming to be in a period of consolidation right now as the OBV line is moving through/in the 50EMA. I am noting the OBV will be displayed in it's own picture below.

Bounce from here?If this holds on the 100MA I like this stock right here. This would make a nice double bottom at strong support if we bounce right here.

