Good time for call debit spreads on WMTWMT is back on its September trendline. It is looking choppy lately, this is why call debit spreads ATM are a decent idea for WMT. It has semi low RSI as well. It seems likely to float around for a few days waiting for a potential breakout.
WMT trade ideas

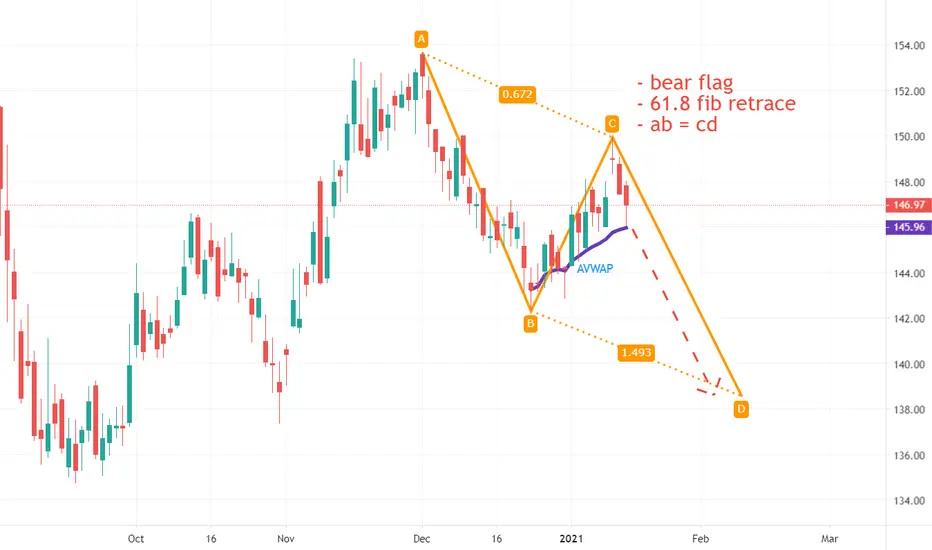
ab=cd in wmt. more weakness to follow.Anchored VWAP provided support today but is likely to cave in per AH price action.
Target 138/9.
WMT ShortGap Down below EMA50
Trendline break
Might be ABC pattern
Short 145
stop 150
Target 135
I am not a PRO trader. I trade option to test my trading plan with small cost.
The max Risk of each plan is less than 1% of my account.
If you like this idea, please use SIM/Demo account to try it.


$WMT | Walmart: Double Bottom and Falling Wedge [Update 3] $WMT retested the $147.50 structure level after breaking out. If we hold this support I expect another push to the upside. Watch for a breakout of the channel. Targeting $150, $151


COST-2.525*WMT $WMT Walmart Inc. vs. $COST Costco Wholesale CorpQuantamental Tools for Proprietary and Retail Investors.
Statistical Arbitrage Opportunities Delivered to Your Inbox.
QuantChart. io
Long 1000 $COST
Short 2525 $WMT
Mean Reversion Time: 12 Trading Days

Walmart ranging in upwards channelWalmart trading in the upwards channel. First resistance is about 153, the previous high. Once we break above the resistance, we can see a further upside movement

Buy Walmart 12/1/2021 Walmart is moving in a short-term bullish trend
Moving average 13 crossed 34 up
So you can buy a target of 156.8, a stop loss of 137.2

WMT LONGWMT just hugging the bottom of the channel
broke the falling wedge bullish
looks ready for a run up the channel
going to buy some ATM calls for 45 days out tmr
and sell some weekly calls against it
will likely take on 5 calls

WMTGot in this name right around the bottom near $143. Got bored with it & sold my last position today only to see it up another $2 after hours. Oh well. Probably sees new ath then $163 before too long


$WMT resisted at 50 MAresisted at 50 MA, 8 & 20 MA trying to attempt golden cross. If it can close above 147.3, could make another attempt to ATH

$WMT | Walmart: Double Bottom and Falling Wedge [Update 2] $WMT printed a bull flag after retesting the breakout structure.
I am looking for further upside into next week.
See my previous post here:

good dip entry here, but be careful if support breaks.potential dip entry, trying to bounce off simple moving average and big trendline support. entry 145 stop loss 141 target 153, decent risk reward.. this one moves too slow for me and doesnt hold gains at all though, so im not touching it for now. goodluck to longs though :)


WMT Long Income Walmart had a great day today despite the selling on the first day of trading for 2021. Hidden Bullish Divergence mapped out using the trend lines on price action and the RSI. Almost have a golden cross on the MACD daily time frame. Also, trading above the 200 SMA on daily and weekly time frame. I don’t see why you would not take a position here.

$WMT Walmart On the Shopping list
Very strong day for the retail giant,
Closed above the 50ma after a channel break on
higher than normal volume.
Targets as per resistance levels.
Indicators very bullish also, in nice reversals.
RSI crossed mid point- cover signal

$WMT | Walmart: Double Bottom and Falling Wedge [Update] $WMT bullish wedge pattern is still valid after price printed a double bottom.
Confirmation above $147. Target $150.
Previous Analysis here:
Good luck!


WMT1/3/21 - 1D Time Frame
** price broke 50ema and was rejected once but 142.23 support seems to hold.
1. Price currently trading at bottom channel, and channel seems to hold.
2. MACD - histogram bearish momentum losing strength and lines about to kiss
3. stochastics at the 40 area with more room to go.
Disclaimer
I do not know how the market will move tomorrow. All my post is not a recommendation, advise nor a suggestion and should not be used as a replacement for investment advice from a qualified licensed professional. All my post is for practice, informational and entrainment purposes only as I am not a registered investment advisor and do not offer investment advice and recommendation. You, the reader, bear full responsibility for your own investment and trade decisions and should seek the advice of a qualified securities professional before making any investment or trade.

WMT $155 (15 Jan 21) CallNYSE:WMT Long Call
I am a casual trader while managing own online business.
I earn the side-income from options to pay bills, put food on table and even funding my annual travel =D
If you’re wish to do the same, consider to follow me here as I give detailed analysis on TradingView.
All my ideas are for my own opinion. There is a high-degree of risks involving leverage trading. Trade at your own risk. This is not financial advice.
If this chart help you to earn some penny. Appreciate if you want to donate me. TQVM 🙏
