WMTD trade ideas

$WMT with a Bearish outlook following its earnings #Stocks The PEAD projected a Bearish outlook for $WMT after a Negative Under reaction following its earnings release placing the stock in drift D with an expected accuracy of 50%.
If you would like to see the Drift for another stock please message us. Also click on the Like Button if this was useful and follow us or join us.

Walmart Ponzied - Shipping Costs Skyrocket - Made in ChinaLarge cap ponzied stonks. Small caps with revenue growth and profit TODAY, matter most in a rising rate environment.
Shipping Container costs make the giants a disaster to own with rising rates and falling revenues and profit margins. Margin compresson incoming. Ponzi Pogs Poof.
*valuation matters
#cannabisreform legistlation
$GNLN
#thegem


WMT stay long for breakoutStay long for symmetrical triangle breakout which is very explosive, Grandpa style

Short WMT below 134.4Alligator's Mouth is closed both in the daily and weekly.
Last daily fractal is 139.77. If reached, it would be valid as the Balance Line is at 140.19.
The weekly fractal is at 134.4. If the train departs to the downside, I would sell short at 134.4. (Early entry could be 139.77 and then heavy add on below 134.4.

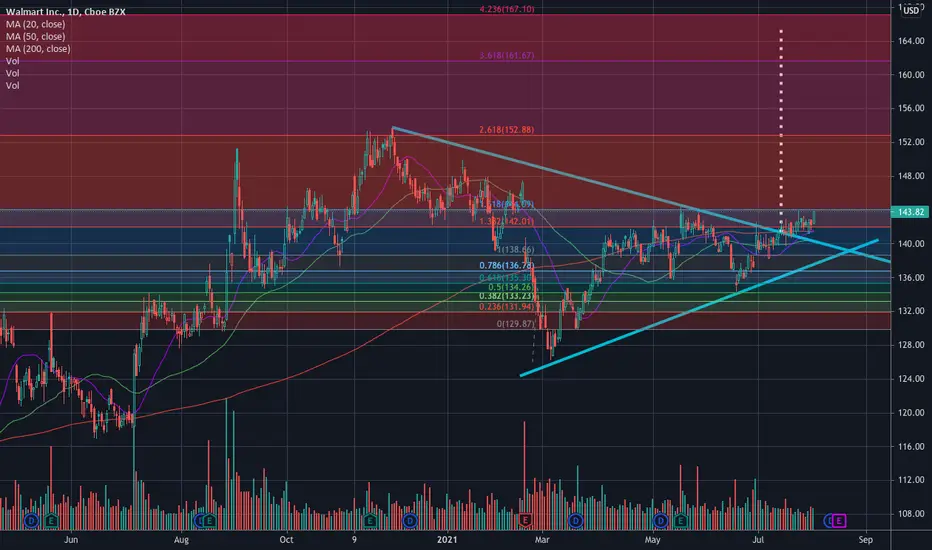
$WMT - Symmetrical triangle breakout Breaking out of symmetrical triangle. A breakout above $144 is bullish.
Resistance - $144
Good case - $152
Best case - $164
———————————————————
How to read my charts?
- Matching color trend lines shows the pattern. Sometimes a chart can have multiple patterns. Each pattern will have matching color trend lines.
- The yellow horizontal lines shows support and resistance areas.
- Fib lines also shows support and resistance areas.
- The dotted white lines shows price projection for breakout or breakdown target.
Disclaimer: Do your own DD. Not an investment advice.
Bull Run SoonWe may see WMT pull back slightly to make up for the overbought RSI and it being right at resistance on the daily, however, once it gets to the end of the trend triangle there, if it breaks past resistance, we could see it rip upward. These are my thoughts.


Needs to Break $143If WMT breaks $143 we could see it enter an uptrend to the top of the trend channel

WALMART OUTLOOKThe chart looks extremely annoying, having lots of small candlesticks (->no Momentum=no trend).
I would recommend to watch for high volume plays.
As always I draw my expectation on how the stock could move in the future.


WMT for a great long playWMT doesn't give AF if the fed is talking about inflation. WMT doesn't care about infrastructure deals. WMT looks at the COVID crash and laughs it off, respecting its own trend line... Sure, you would play the weekly and monthly contracts on the small jitter, but WMT is a great example of the slow, methodical, and deliberate climb up. This is a prime candidate for a LEAP or even running a PMCC.
This is not financial advice. I just look at squiggles and fit lines to them.

Symmetrical TriangleThis pattern is neutral until a trendline has been broken with conviction.
Possible stop under bottom trendline or somewhere you see support inside the triangle.
WMT has been in consolidation mode for quite some time. Also filled a gap.
No recommendation
$WMT Chart IdeaThe breakout to the upside of desc. triangle is a healthy setup for a bullish trend channel. We will probably see some dancing around in here if we are lucky... that would mean more day plays.

$WMT Descending Triangle Breakout IdeasBeen watching for the past week, getting closer to a move now so I thought I'd publish a chart. Obviously a great stock, my leading theory is we will see a double top sending it back to support before the final leg up/breakout.

Walmart Breakout? Theory: If candle with arrow on MACD closes green (1:30pm EST would be candle close), this may suggust a new wave of buying pressure.


WMT on the way to TP/ReentryPlease refer to our MMM (3M) analysis. Same condition. Make sure to apply set loss and take profit level to all your trade.


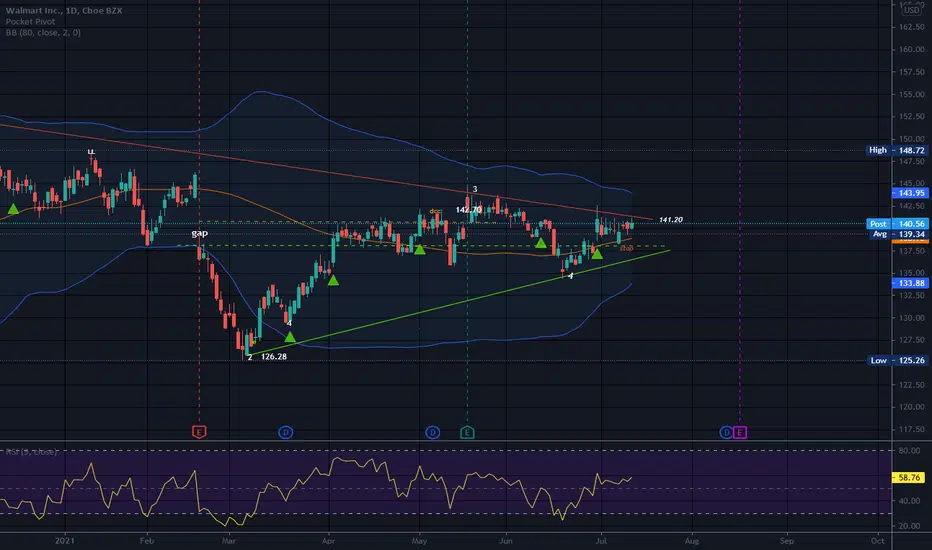
WMT breakout incomingWMT 4H | I like the way $WMT is looking. Setting my alerts for a potential breakout in the upcoming weeks. Potential call ideas is $145C 8/20 expiration.
Current Price: $140.82
Support: $139.91, $138.20, $136.78
Resistance: $141.02, $142.20, $143.25, $145, $147.85
