A Leader in the 2020 for Meeting SolutionGartner, the world’s leading information technology research and advisory firm, has positioned Zoom in the Leaders Quadrant of the 2020 Magic Quadrant for Meeting Solutions.
ZMD trade ideas


ZM BUY OR LONG , TARGET $500 , $600ZM It's time for us to acquire this wonderful company, initial target of $500, then update to a higher target (maybe $600) , the
pattern right now is " SHS PATTERN " , #SHSPATTERN.

More Potential downside for zoom and other tech stocks?Coming further down with news over inflation. We may see a small bounce tomorrow, but overall more downside especially for next week more than likely. It wouldn't necessarily be a crash, but it would be a large correction, especially for the tech sector and the spy.

HopeBullish Engulfing candle with good volumes can raise our hopes that this might be it. But before we make any conclusions, lets see how this trade for rest of the week.

$ZM 30m bounce trendline(see lnkd chrt)$ZM 30 min bounce from my trendline(see linked chart from past)

ZM - Bullish only if can go above 340ZM - This wave 4 correction I talked about a few months ago turned into a combination it seems and reached equality of wave W vs Y.
Price also bounced off the anchored VWAP from the wave 2 low.
But I don't recommend blindly buying right now, unless using tight stops of course, but rather wait for a confirmation that price really wants to turn first.


Zoom Inc. (ZM) - LONG - Enjoy the fifth wave rally !!The 3rd wave has retraced so far below the 0.5 level i.e. 323.91 and is expected to retrace till 0.618 level of Fibo i.e. 261.74, completing the fourth wave.
The position could be squared off at around1.618 level of Fibo i.e. 915.21.
Enjoy the fifth wave rally !!


ZM 2/18-2/19/2021 MAJOR LOSS CASE STUDYLOSS for about $4,000+ on that trade series!!!
WORTH LEARNING IT FOR A LONG LONG LONG TIME

$ZM currently trading at the Demand ZoneI believe a 48% pull back from the highs is a reasonable correction. Now is the time for $ZM to establish its new bull trend. With a descending triangle formed from the highs and break of $300 support into the $290s demand zone poises it for a bounce with MACD oscillator curling green after 2 months in the red. All the way down to the $270s is a good buy zone. Anything below $270s and its $200s next, I would stay away below that range.
This would be a great pick for the long-term investor. Please share, like and comment your thoughts below.

520 could be a next target for ZOOM After 3 has formed a double zigzag where it has ended with ending diagonal and bearish divergence signal.
Now the price could go up to 520 or higher if it's not a 5th wave failure and we can use Fibonacci lines as a target.

ZM - GREAT Short Opportunity, IF ... !!Hello! Friends,
- This would be a great short Opportunity, IF NASDAQ:ZM breaks down the Daily Support line at $317 (with a WHOLE DAILY Candle) !!

Traditional|ZM|LongLong ZM
Activation of the transaction only when the blue zone is fixed/broken.
The author recommends the use of anchoring fixed the blue zone, this variation is less risky.
If there is increased volatility in the market and the price is held for more than 2-3 minutes behind the activation zone after the breakdown, then the activation of the idea occurs at the prices behind the activation zone.
The idea is to work out the resistance level .
* Possible closing of a trade before reaching the take/stop zone. The author can close the deal for subjective reasons, this does not completely cancel the idea and is not a call to the same action, you can continue working out the idea according to your data, but without the support of the author.
+ Maybe right now we will go even lower, then it's okay, the idea is not activated and simply canceled.
+ ! - zone highlighted by the ellipse is a zone of increased resistance, in this area there is a possible reversal for a correction, please take this factor into account in this transaction.
The "forecast" tool is used for more noticeable display of % (for the place of the usual % scale) of the price change, I do not put the date and time of the transaction, only %.
Blue zones - activation zones.
Green zones - take zones.
Red zone - stop zone.
Working out the stop when the price returns to the level after activation + fixing in the red zone.
Orange arrow - the direction of take.
The red arrow - the direction of the stop.
SUM PNL: This parameter displays the total % of all closed ideas of the "new" format (according to the author) for this sector at the time of publication of the idea. The calculation is very "clumsy" just the sum of the profits of all the ideas, based on this indicator, you can more accurately assess the risks when working with my ideas of this sector. I present you the construction of the idea, you can use it yourself as you like based on your subjective view and risks, the calculation of the PNL indicator is carried out only on transactions that the author closed on TV in manual mode or by take.
P.S Please use RM (risk management) and MM (money management) if you decide to use my ideas, there will always be unprofitable ideas, this will definitely happen, the goal of the system is that there will be more profitable ideas at a distance.

Momentum buildingGot stop out of my 325 Long and brought back in at 302
Huge momentum flowing in this morning
Money flow still increasing-- Still in larger down trend with death cross struggle
Bank credit upgrade on 3/26 Deutsche bank
I think we can go to the top of the accumulation range at 360 before we see major reversal UP or back down


Trading idea on ZM - Good risk/reward ratio!Hello dear community! This is my first post here, so, I hope you like it 😊
I want to share with you a trading idea on ZM 🚀:
Buy point: 314.58
Stop-loss: 311.79
Exit point: 325.48
Risk/Reward ratio: 3.91
If you liked this trading idea, remember to click on the “Follow” button to get more trading ideas like this, and if you agree with me, click on the “Agree” button 😉.
See you soon,
Melissa.

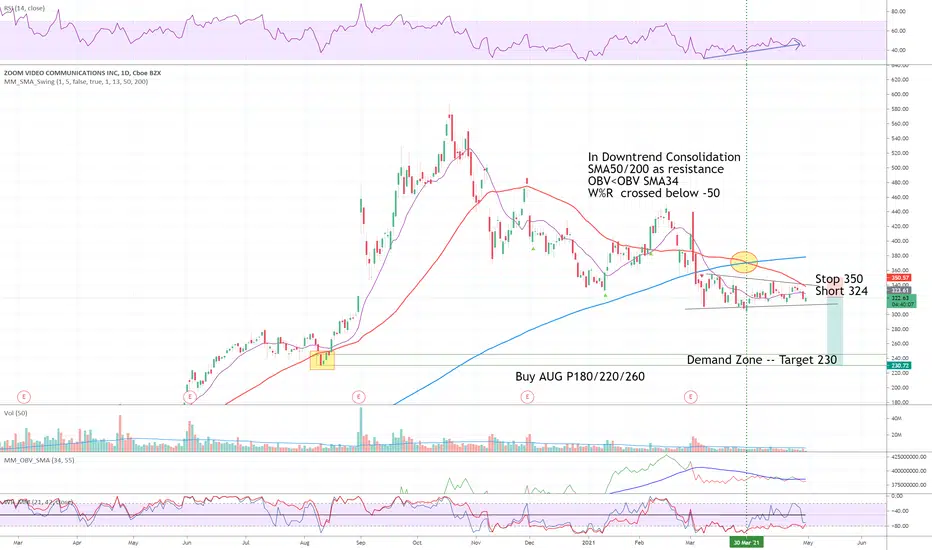
ZM ShortIn Downtrend Consolidation
SMA50/200 as resistance
OBV<OBV SMA34
W%R crossed below -50
Short 324
Stop 350
Target 230
I am not a PRO trader. I trade option to test my trading plan with small cost.
The max Risk of each plan should be less than 1% of an account.
ZM - very high reward in the next couple weeks before ERZM is looking for to break out of the giant ascending triangle that sellers created back since October 2020. And if ZM created another golden cross like it did back in Feb 2020 then we will see a huge move return back to the uptrend (The triangle to me is like accumulation zone to prepare for the big move). In general, ZM is still in the long run bull market if it won't create death cross in the next few days. If we look the whole pic, ZM is just started the bull run since Feb 2020 after almost 187 days of accumulation.

$ZM Preparing for massive move upside The pattern is considered as a sloped accumulation. it will target higher numbers.
