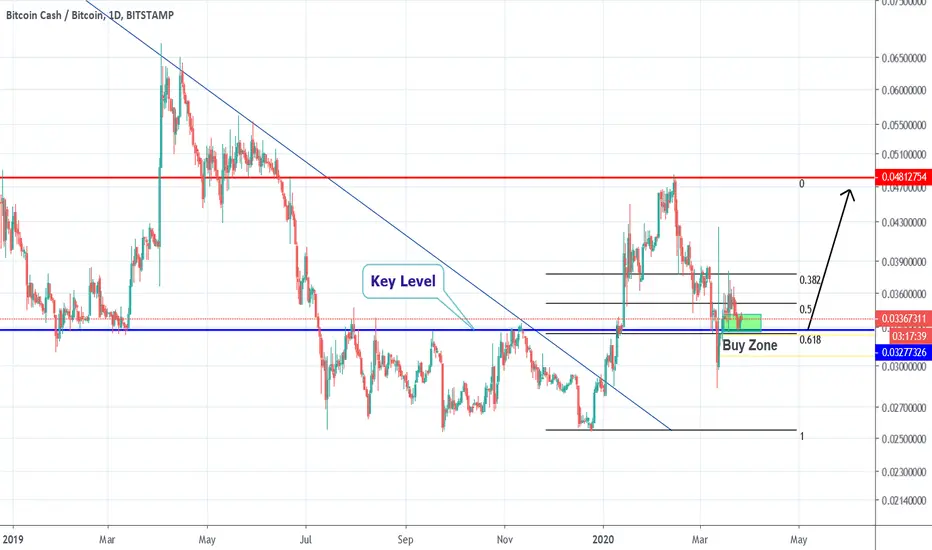
BCHBTC trade ideas

BCHBTC is in Buy Zone!The price moves in the Upward Range Channel!
I think it's a good buy opportunity near the bottom border.
Potential profit will be 3 times bigger than the risk.
Push like if you think this is a useful idea!
Before to trade my ideas make your own analysis.
Write your comments and questions here!
Thanks for your support!

Bitcoin Cash Trading IdeaHello Traders,
Bitcoin cash reached an importante support level which is also coincident with the 0.618 of Fibonacci. This region is the ideal region for a reversion in price if it is going to continue the previous uptrend.
Please push like button and follow us on trading view.

Bitcoin Cash Is Forming Bullish BAT For Upto 24% Profit SoonFormation of harmonic bullish BAT pattern:
The Bitcoin Cash with Bitcoin pair is forming a harmonic bullish BAT pattern and soon it will be entered in potential reversal zone to give chance to earn more gains.
Let’s dig the pattern deeper to see how perfect it has been formed.
After initial leg (X to A) the A to B leg is retraced between 0.382 to 0.50 Fibonacci and then B to C leg is projected between 0.328 to 0.886 Fib of A to B Fibonacci projection area now the last leg (C to D) should be retraced between 0.786 to 0.886 Fibonacci level.
Buying And Sell Targets:
The buying and sell targets according to harmonic BAT pattern and its Fibonacci sequence should be:
Buy between: 0.0296 to 0.0286
Sell between: 0.0320 to 0.0356
So this short term 12 hour chart based idea has capacity to produce upto 24% profit.
Stop Loss:
The potential reversal zone area that is up to 0.028646 sats can be used as stop loss in case of complete candle stick opens and closes below this level.
Note: This idea is education purpose only and not intended to be investment advise, please seek a duly licensed professional and do you own research before any investment.

A Descending Triangle is Forming on BCH [QUICK UPDATES]Hey all, the Trading Guru is back with another entry on a new series called 'Quick Updates'.
We see BCH here with a strong bearish trend currently. It is reaching a point of support, but it doesn't look like it is really going to hold. I expect the price to bounce a little bit, confirm the triangle, and break through the bottom support line.
The intuition behind a descending triangle is that there is a support zone at the bottom, with multiple attempts to break the support. After every bounce, the bulls slightly decrease their power. At some point the bears break through the support zone , and will create a sharp drop in price.
--- What is The Quick Update Series All About? ---
I am starting a new tag (quickupdates) where I quickly share great opportunities based on TA for shorter timeframes, such as 4h, 1h, and 15m. It will not contain just a short explanation, in order to keep the velocity up and make sure you get to see the opportunities as fast as possible.
Follow me for consistent high quality updates, with clear explanations and charts.
Please like this post to support me.
- Trading Guru
--------------------------------------------------------------
Disclaimer!
This post does not provide financial advice. It is for educational purposes only!
About the links below:
20% Discount on Binance: Did you know that Binance introduced a new system where you can get 20% discount on your fees? Find the step-by-step guide on how to add it to your account on the website of 100eyes
Forex & Crypto Scanner: Nobody can keep track of all the pairs on all timeframes. This scanner works on Telegram and sends an automated message including a chart every time something happens to a coin. E.g. it can automatically detect areas of support and resistance, RSI Divergences, Fib Retracements, and more.
Also, check my recent popular ideas on BTC:

Multiple hints to short BCHSup, plenty of things suggest BCH would be a good short position for a quick profit in the matter of a few days.
H&S pattern suggest we are in the the 2nd and last shoulder with a profit pottential of arroudnd 12%
Fib retrace shows that the current price action is passing the 0.61 retrace, the last strong support.
Stoch shows the price about to fall below the overbought zone.
thoughts are welcomed

BCH ANALYSIS: LONG THE NEW SUPPORTBCH ANALYSIS:
BCH held the 200MA and flipped bullish as it broke above the previous resistance block. That same block is now outlined in green and is now flipped to the temporary support. Currently sitting on a 4HR green wick, it looks likely this spot will zone. The re-attempt at the hourly block is likely in which I expect another rejection to occur. Look for entry inside the zone just below 3500 sats down to 3450 sats. The take profit targets are T1 at 3545 sats, T2 at 3620 sats, and T3 at 3688 sats. Recommended to close full position before hourly resistance hit. If BCH does break ABOVE this zone, we can enter for a new long up.
Possible Entries: 3450-3500 sats


BCH support turned resistanceNot considering buying this until we get a weekly close above resistance

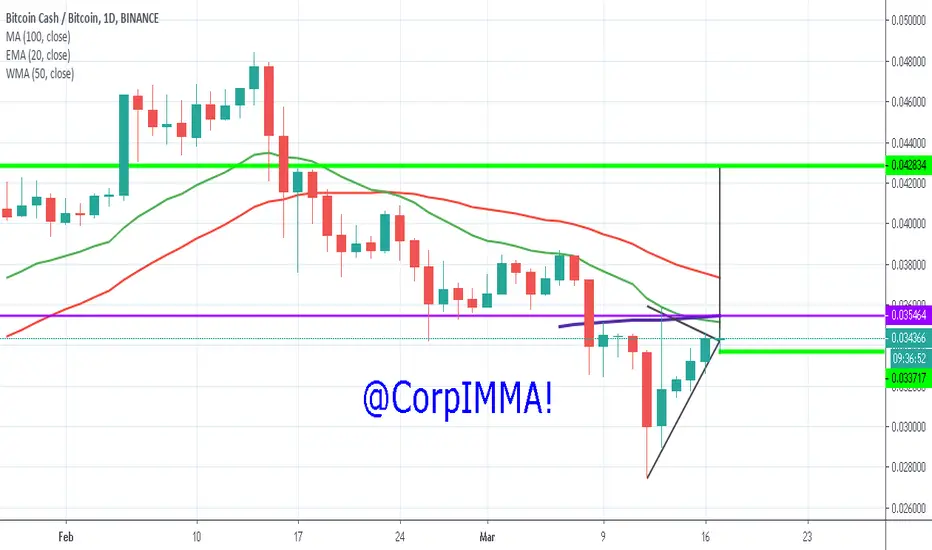
BCH/BTC, 1D. next price 0.042834btcHola Megagente, de manera rapida y sencilla lo que a mediano plazo considero que va apasar con el precio de este par, claramente muestra recuperacion y esta retomando el alza. ese punto maracado ha servido de soporte y resistencia asi que considero que al llegar ahi tendra un posible rebote hacia abajo. OJO puede pasar lo contrario, ya sabes como es esto... Exito para todos
Bitcoin Cash | Bullish View Mapped (87%, 150%, 250%+ Targets)Good Sunday my dear cryptocurrency trader, here we have for you the Bitcoin Cash (BCHBTC) daily chart.
Today I would like to share with you the bullish targets for Bitcoin Cash, meaning, the levels at which BCHBTC will find resistance on the way up.
On the 12-March BCHBTC had a very strong drop, but the candle that followed on the 13 produced even bigger jump with really high volume, signaling that this retrace reached it climax and Bitcoin Cash can change its trend.
Conditions for change
0.786 Fib. remains as the main support (0.030368).
We remain bullish on BCHBTC as long as prices remain trading above this level. If prices move below 0.030368 we turn bearish, the above signals become invalid and a new analysis is needed.
Thanks a lot for reading.
Namaste.


BCH could get rejected by this resistanceBCH is touching a major resistance. Chances are that the price goes down from there.

BCHBTC - 61.8% Fibo level reached with double Zig ZagDouble zigzag (WXY) Elliot correction happen on BCHBTC chart, we reached 61.8% Fibonacci level. Now we will climb the hill up. Long

BCH/BTC TA Update (Bullish Pattern Confirmed?)BCH/BTC
BCH broke bullish of this inverse H&S pattern and currently testing the old resistance to potentially turn into new support territory.
Bullish momentum cross of 26 EMA and 50MA on the 4H time-frame gives us to shift bias to the upside.
Now, BCH needs to hold this current price levels for at least 24-48H to keep this short-term uptrend intact.
A price drop close below 365 sats will invalidate this trade.

BCH/BTC - triangle playBCH formed pretty textbook triangle. I personaly think, that this is bearish triangle, part of wave 4, so I am in short right now. However, it could also be bullish triangle, part of corrective wave "B". I will be tracking that and I will exit my short and go long, if I see signs, that this is bullish triangle.

BCHBTC LONG - Snake pattern to outperformHey everyone!
Bitcoin's cousin appears to be holding more steam that is ready to be released at this point.
A sneaky one but generally these just explode!
I'm in :)
You?
Take care,
Vlad The Crypto Trader

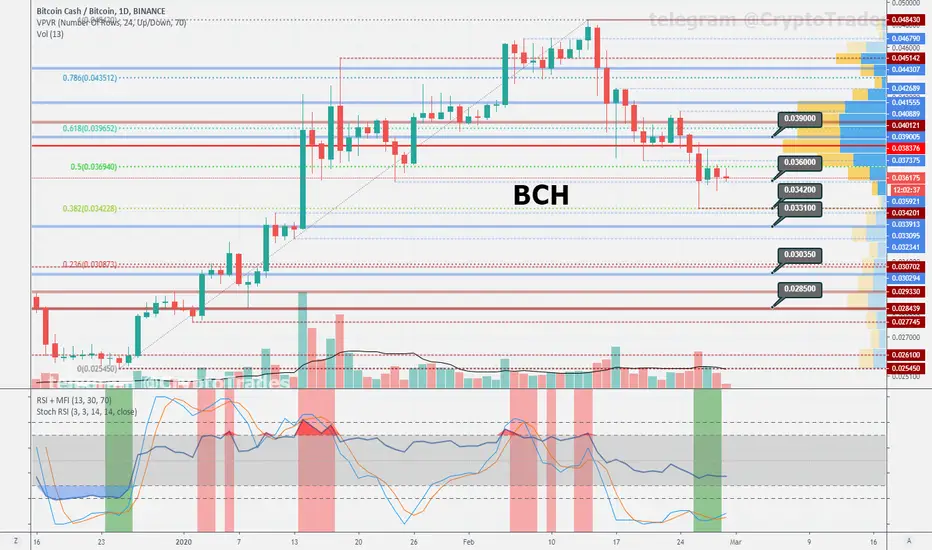
Bitcoin Trash analysis
BCH bounced from 34200 which was also 0.382 Fibonacci level. Good bounce zone to stop retracement and start consolidation stage. At the same time this bounce couldn't take it above 0.5 Fib level, so BCH is still in risk zone of dumping lower. You may use below zones for swing trading between them. If today candle close above 36000, it will be a bullish sign.
Support zones: 34200 - 33100 - 30350 - 28500
Resistance zones: 38200 - 39000 - 40000
P.S. Prices at Bitmex are the same.

2020 Halving Leaves Traders Golden Cross-EyedBitcoin refuses to leave the 10k launchpad from the 9.X resistance area multiple times. Positive sentiment leads traders into a trap. News of the "Golden Cross" and "The Halving" trumps all, but we can't all be winners. The promise of easy profit leads traders and investors into one of the largest bull-traps of 2020 so far. Bitcoin falls through the floor from $10050 to $8500 in the matter of days.
The question is, is it over?


XRP and BCH - wedges in play ?BTC is on strong support and could be ready for some bigger retracement -> that would mean, that highcaps will also recover and BCH and XRP looks pretty good. Only BTC dominance doesn´t support these wedges, because BTC dominance should go up, so altcoins should be dropping for some time, so hard to tell. But I open LONG on these two pairs with small stop loss.
