BCHBTC trade ideas


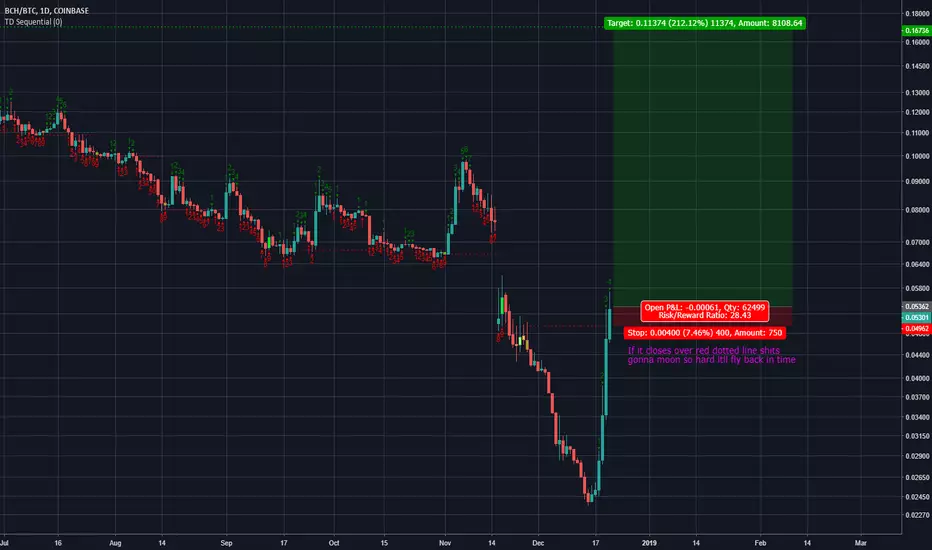
$bch cleared for liftoffin three... two...
could very well die if it falls under red dotted line.. just nice RR here with clear invalidation.

Bitcoin Cash Continues On The Path of The Deuceshort is the best option, only risk is a black swan event that launches it up to #1 resistance

BCH - Bouncing off all-time low, ABC is ready to dust SVLooking at the daily chart for BCHABC, I see a lot of things I like. We have a bullish cross on the daily MACD as it rounds off key support. The two previous times BCH touched this support,the price took off to all-time highs. But take that with a grain of salt as it's important to remember those pumps occurred in a bull market and this is a bear market. The RSI, however, is very low at 21 and was as low as 16! And for the daily RSI no less. Now that Bitcoin is showing signs of reversal/recovery, the alts are also recovering. I think there's a lot of room up if this is a short-term bottom for BCH. My initial target is resistance at .06. If we get some serious volume maybe we touch higher. Either way, it will put some serious distance between ABC and SV as it should be.

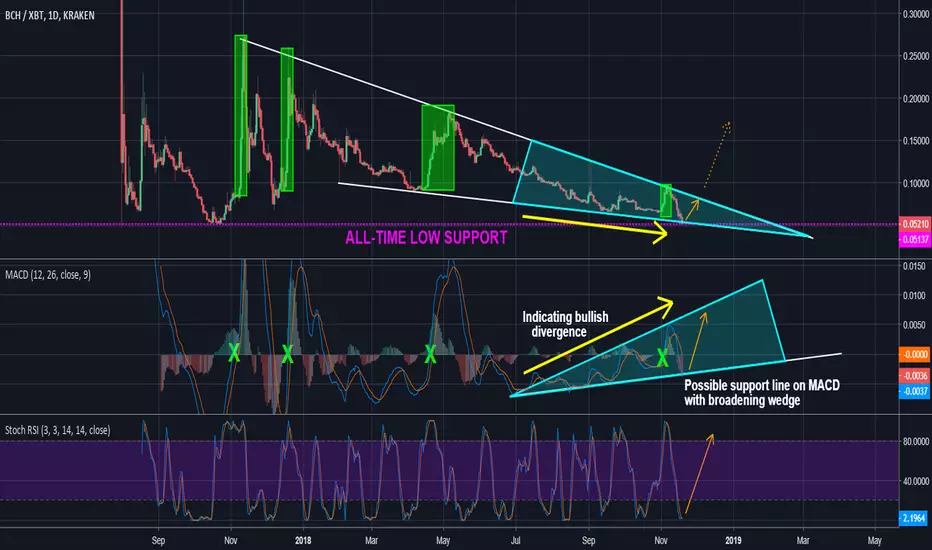
BCH - Call 911, BCH is on life support! Looking at the daily chart for BCH/XBT, we can see that it is sitting at a new all-time low. The price action has been in a falling wedge since last year and is currently sitting on its last line of defense. Nevertheless, there are some positives. The daily RSI is oversold at 26 and is due for a bounce. Support can be seen on the MACD and price chart.
BCH tends to have a knack for pumping hard at low points and then slowly selling off its gains. This may be an ideal time for a low risk-high reward trade. Buy at this level and have a tight sell-stop. The target price is the upper boundary of the falling wedge at .08.
Current Price: .0418
Buy - .04-.05
Target - .08
SL - . 039
Let's see if we can bring some life into BCH!
Cheers!

Bitcoin Cash - Coinbase All Time High Volume SpikeOver the past week, BCH has seen numerous large volume spikes one of which resulted in an All Time-High volume on Coinbase.
These large volume spikes were no doubt fuelled by uncertainty and volatility presented across the market by the most recent Bitcoin and Ethereum drop and could very well present an opportunity for short to medium term profit.
As you can see from my Technical Analysis, BCH short-term price action is currently sitting in a steep falling wedge due to the most recent market sell-off.
This type of steep falling wedge is very unsustainable if we factor in how low BCH is from previous highs and price action in September.
This presents us with an opportunity to scale in around support levels or after the falling wedge has clearly been broken in hopes of short-term profit.
The following values are purely my short-term trading values for BCH and should not be construed as financial advice.
Accumulation Zone 1 (support) - 0.07500sats
Accumulation Zone 2 (support) - 0.06750sats
Accumulation Zone 3 (breakout) - No specific value, wait for clear breakout.
Stop Loss - 0.06400sats
Targets - 0.09000sats, 0.10400sats, 0.11500sats
Clear ascending support formed on MACD on the 4h, and 8h.
Due to the recent high volume spikes if you wish to follow along with this trade you must ensure you stay up to date with real-time price action and practice efficient risk management.

BCH - Hitting all-time lows and support. Time for a bounce?Before I begin, I would like to preface that this is not a trading market with Bitcoin as bearish as it has been. As such, BCH will likely continue to be be negatively affected if Bitcoin continues its descent. However, BCH appears to be hitting several support levels all at once. First support line comes from the falling wedge that BCH has been in since this time last year. Currently, the price is approaching the bottom support trend of the wedge as well as hitting the all-time low. The Stoch RSI and RSI are indicating oversold levels. Bullish divergence can also be seen on the daily. The MACD has also broken the zeroline. History has shown that practically every major BCH run has occurred when the MACD breaks the zeroline. We may be in for a short-term bump to the upper boundary of the wedge at around .08. A breakout beyond this resistance level could be a very bullish indicator. But I cannot stress enough that this is Bitcoin's show at the moment. I would be watching for indications of reversal in the price action, not just the indicators.

BCH ANALYSISBCH/BTC(COINBASE) ANALYSIS
next off we have bch against btc, its pretty similar to what we have seen in bch/usd , the targets for this retrace are likely around 0.079-0.08 and I will be looking to short with a target of 0.072 and stop at 0.0805 for a nice risk to reward on this setup #batman


BCH bull run before forkimpulse move up after W bottom formed. Broke above bull pennant and currently consolidating for more upward movement. Targets on chart.

BCH finds support before going higherLooks like we have a strong support before moving up to the next zone. Chart is pretty self-explanatory.

BCH: Is Roger Ver about to be laughing or crying?Historically we have bounced from this support/demand zone, a close under and BCH could dump off, or it could be a fake out before the bull run.
Watch for a confirmation of bounce of the demand zone, MACD cross as confirmation of reversal.
Normal RSI is looking good. I think the stoch can come down a little bit so we test the demand zone again.

Bitcoin Cash a week before hard-forkI'm bullish here, bitcoin cash hard fork news has not caught legs yet
when ppl find out they can get two bitcoin cash for bitcoin as confirmed by coinbase/binance...
poloniex even has trading pairs already up that's interesting lol
eyeing 0.12 to high as 0.15 leading up to the hard fork
Like the R/R here
there's so much hatred for Bitcoin Cash and shorting it is becoming a popular trade, gives plenty of fuel for the run up.
Breaking down below the purple box or something drastic happening with the hardfork would invalidate this idea
Looking to hedge at these red circle areas around resistance blocks
popcorn time


BCH: Feel sorry for you if you brought the top of this pumpBCH showing Bearish divergence on 4HR and RSI pivot on 1D..
looks soon this baby will come down crashing


BCH long opportunity Use low leverage this looks solid, good luck I will keep update , a like would be appreciated and follow me on twitter for my own trades as I enter every trade I post and if u following me you should of been in this long from the bottom,good luck and text for any questions.

A Level of interest for Bitcoin Cash the real Bitcoin ?BCH on the move, watching this purple box for a potential setup.. not sure which way yet depends on how it reacts when we hit that box
short term bullish but watching that black line, maybe look for a short play if support breaks there

around 3k 0.50btcseems bitcoin cash is on a reversal with a nice uptrend correction to 3k perhaps due to the fork hype and fomo for November 15th watch for peak around 12th nov

BCHBTC ideaBitcoin Cash as most of the altcoin is forming a symmetrical triangle in the daily timeframe.
This is my personal opinion and this is not a financial advice!
Good trading!
