BCHEUR trade ideas
BCH meets heavy resistanceBCH is testing both the 200 day simple moving average and a major downwards trendline. A breakout above those could be a very bullish sign for BCH.
BCH has already broken above the 100 day moving average and gotten support from it. Time will tell if the 200 also can turn into support.
Nice move!Hello everyone, this is our view on bcheur, enjoy!
Analysis:
Technicals don't lie: huge volume spike detected on small timeframes, signal the pump is not over yet. If whales keep pushing it this way (following the Elliott impulse waves) those are price targets. Brokeout of an ascending channel just to make another one higher which we probably won't break this term. If reaches the major falling wedge then buy at retracement. Golden cross formed by ma9-ma25 on last candle, maybe marking this breakout or, more probably, completing this small uptrend. Wma25 supporting the price very well, an eventual breakdown would bring us to second trendline, but not to my stoploss. Bullish engulfing marked on chart. Overbought on bollinger, wait for a retracement, don't fomo. Very big ichimoku cloud and keeps super bullish. Big bullish divergence and smaller bearish divergences on fisher, i believe we'll retrace and then go up once again. Bull divergences on many laggings (chaikin, moneyflow, rsi, stoch (14,3,3), uo). Stoch also looking good on smooth 50. Very good momentum marked on ao and macd, which is also forming a golden cross. Greed accumulation.
Strategy:
Wait for daily closure or follow our entries and targets
Entry: 218.35-215.19-197.07
Target (short-term): 238.77
Sell (mid-term): 246.46-258.14-277.73-300+
Stoploss: 188 (8% from average)
High risk for big gains!
Trade safe. Anlvis.
Bitcoin Cash to hit $153 - $143. Good chance to go Short. This looks like a very strong TA.
There's alot of pressure on the daily chart and the bulls are working to hold it from going lower but as seen on 4H chart it's now battling on resistance level.
I see this getting rejected at current price level and stomp back to close around the opening.
For the rest of the following weeks it will stay in this downtrend.
Also 13 EMA on daily chart is acting as a resistance upon the bulls. Volume is not quite enough on this level.
RSI looks also waterproof proof that this will reject. I'm waiting for a break in the RSI and seeing the bears take over and push it to the lower supply zones as shown on my chart.
Love to hear your comments.
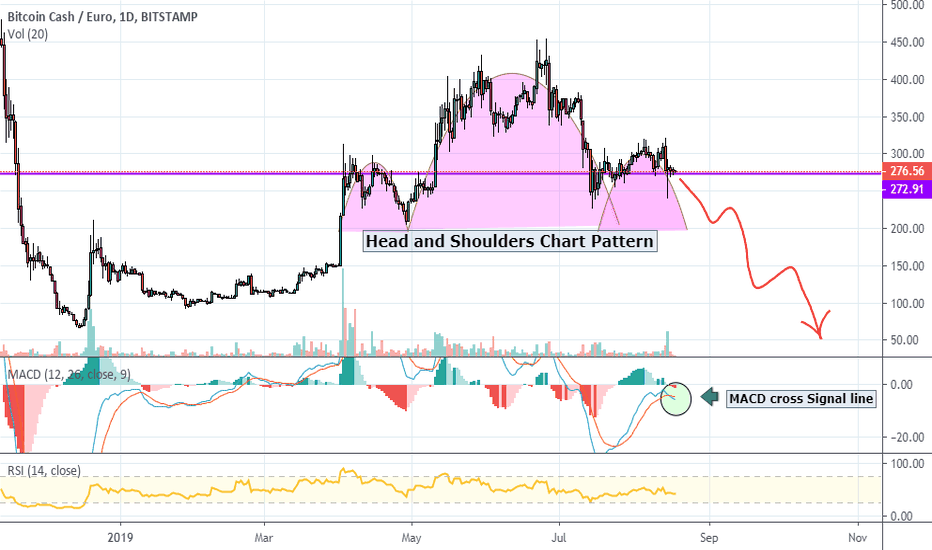
Head and Shoulder Chart Pattern on BCH EURDear Reader,
As I was reading charts, I came across this head and shoulders pattern. This pattern is highly respected and valued among traders.
As addition to the Pattern the MACD is crossing the signal line, giving an indication of bearish momentum. The Price seems in an stable (as the RSI indicator shows)position and has room to move. I am excited to see if my prediction will be a successful one.
Warm regards,
Morning Light,
BCH/EUR prolongation a short-term analysisIn confirmation of the previous analysis "BCH/EUR short-term analysis",BCH/EUR entered the area giving a good opportunity to make long trade.
It is imperative to wait for a clear and valid alert to enter into a deal!!!
After the upward movement to 456E, BCH/EUR make a correction (a-b-c) to 228E 23.6% FIBO level (or 50% FIBO of the entire upward movement started from 65E (15-Dec-2018).
This is a good level to complete a correction. ( Whether the market knows this? )
The next level we can expect support is 207E, that is 38% FIBO of the entire upward movement started from 65E (15-Dec-2018).
At very deep correction we can see a new 156E test.
In the near future, I expect to see a horizontal correction to levels of 330E and 410E.
BCH price recovery pointThis is no financial advise, Take the info with grains, lots nd lots of salt grains. anyways :P we should see an increase of almost 60 eur when the price touches/levels with the yellow line, followed by a dip down, and slowly passing below the yellow line. Now do as you may :P ;)
BCH Quick channel trading tipsBCH is one of my favorite cryptos because of its tendency to pump a lot faster than others. Who wouldn't love to catch that wave?
Using this channel (thin lines) you can more easily predict where BCH is going, whether it is a pump or a correction of a pump. I like holding my shorts/longs just inside that channel to make sure I don't get too greedy like I used to be.
The thick line is to determine a breakout of this channel, and that breakout can be our next big classic BCH wave you always see while you have your money on other cryptos. Don't be on a wrong train when BCH goes up.
Also, hold your stop loss below the lower part of the channel. If BTC gets a correction (which I think it will), other cryptos will follow as well. Full green line is the current big support level that got switched from the most recent resistance level. Breaking that support level along with the channel will give us a correction.


