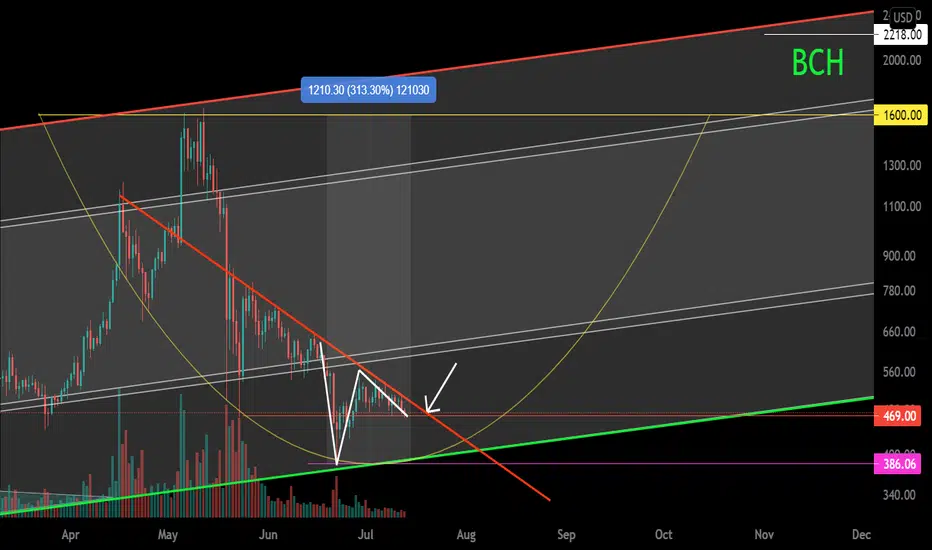
BITCOIN CASH SOCIETYRecently we saw u huge correction for all crypto's
For me this created a great entry point.
Because of inflation and current market situation
I expect many more for this space to come
Stay safe out there.
Lets try to move to target 370!
BCHUSD.P trade ideas


BCHUSD Potential for Bearish Dip | 14th April 2022Price is on a bearish momentum. We see a potential for bearish dip from sell entry level of 349.95 in line with 61.8% Fibonacci retracement towards take profit level of 318.11 in line with 61.8% Fibonacci retracement and 78.6% Fibonacci projection. Our bearish bias is supported by price trading below Ichimoku cloud.
Any opinions, news, research, analyses, prices, other information, or links to third-party sites contained on this website are provided on an "as-is" basis, as general market commentary, and do not constitute investment advice. The market commentary has not been prepared in accordance with legal requirements designed to promote the independence of investment research, and it is therefore not subject to any prohibition on dealing ahead of dissemination. Although this commentary is not produced by an independent source, FXCM takes all sufficient steps to eliminate or prevent any conflicts of interest arising out of the production and dissemination of this communication. The employees of FXCM commit to acting in the clients' best interests and represent their views without misleading, deceiving, or otherwise impairing the clients' ability to make informed investment decisions. For more information about the FXCM's internal organizational and administrative arrangements for the prevention of conflicts, please refer to the Firms' Managing Conflicts Policy. Please ensure that you read and understand our Full Disclaimer and Liability provision concerning the foregoing Information, which can be accessed on the website.

BITCOIN CASH LONGS ACTIVE 📉📉📉📉 Expecting bullish price action on BITCOIN CASH as price action shifted the market strucutre from bearish into bullish making the retracement move back into the bullish orderblock area on the H4 exactly on the psychological figure 300$. We also had a lot of wicks pressure aka buyers getting in on 280$ price area.
What do you think ? Comment below..

BCHUSD about to break a 1 year Resistance line!Bitcoin Cash (BCHUSD) has been trading below a Lower Highs trend-line since the May 12 2021 High. So far we've had 3 major rejections on that trend-line. However the time may have come that we will finally see a bullish break-out above the Lower Highs, as BCH has been trading within a Channel Up (dashed lines) since the January 24 market bottom. If the price tests the Lower Highs again, it will be the soonest double test in that span.
The obvious immediate Resistance levels if a break-out takes place, will be the 1D MA200 (orange trend-line) and mostly the 1W MA50 (red trend-line). Above the Resistance Band of 735.00 - 809.00, Bitcoin Cash enters a new long-term parabolic rally.
Note that what gives more chances to the upside right now is the fact that the 1W RSI is above its MA. If the MA holds as a Support, it will further boost the bullish potential.
--------------------------------------------------------------------------------------------------------
** Please support this idea with your likes and comments, it is the best way to keep it relevant and support me. **
--------------------------------------------------------------------------------------------------------

BCH Wen Moon?Grabbed the 18 fractal and ran a FIB on the 18 bull run (partial).
FULL FIB $16.6k Target
181 Days for some action: June 2022 timeframe
But looks like an EASY Swing trade into the GEM!
HIGHLY SUPRESSED COIN!

SELL BCHUSD until 295.00 !Hello guys !
Here is another trade, I hope successful with MA, Zig-Zag and direction lines. Hope it works.
Looking forward to your comments.

BCH/USD Mid-term work in the channel.A channel has formed in the main trend. Here I have shown potential medium-term work from trend and support/resistance levels. It is also worth noting that a cup may form.
BCH / USD Main trend. Channel. 1 week.
BCH / USD Main trend. Channel. 1 week.Main trend. Term 1 week. From the breakdown of the big triangle, the pumping is more + 500% Rollback. As a result, a channel was formed. Work in it. The potential is very significant.
Under the idea, I consolidated my ideas of working on this coin over the past year, both medium-term and local in nature.
BCH/USD Mid-term work in the channel.

BCH overall mega count and what to expect nextIn my opinion, the whole count seems reasonable if we assume that the 4th wave is already finished and we're on the way to complete the 5th wave. It goes in line with the idea that BTC is currently printing the 4th wave as a triangle.

BCH Testing Back Into A Range before Potential Takeoff to $550BCH has Broken free from a Daily Range and is now testing the old Resistance of said Range with the 55 Day EMA and SMA backing it up and if things go smoothly we should see this rise back up to the next zone of major Resistance at $550

BITCOIN CASH U.S DOLLAR BEST PRICETHE HISTORY OF BITCOIN CASH
In October 2008, Satoshi Nakamoto published the famous whitepaper entitled “Bitcoin: A Peer to Peer Electronic Cash System”. In 2009, he released the first bitcoin software that powered the network, and it operated smoothly for several years with low fees, and fast, reliable transactions.
Unfortunately, from 2016 to 2017, Bitcoin became increasingly unreliable and expensive. This was because the community could not reach consensus on increasing the network capacity. Some of the developers did not understand and agree with Satoshi’s plan. Instead, they preferred Bitcoin become a settlement layer.
By 2017, Bitcoin dominance had plummeted from 95% to as low as 40% as a direct result of the usability problems. Fortunately, a large portion of the Bitcoin community, including developers, investors, users, and businesses, still believed in the original vision of Bitcoin -- a low fee, peer to peer electronic cash system that could be used by all the people of the world.
On August 1st, 2017, we took the logical step of increasing the maximum block size, and Bitcoin Cash was born. Anyone who held Bitcoin at that time (block 478558) became an owner of Bitcoin Cash (BCH). The network now supports up to 32MB blocks with ongoing research to allow massive future increases.

BCH Bitcoin Cash: 1D & 1M Chart ReviewHello friends, today you can review the technical analysis idea on a 1D and 1M linear scale chart for Bitcoin Cash (BCHUSD).
See the Bitcoin Cash price on the 1M (left chart) and 1D (right chart). On the 1D chart there is a ascending triangle bull flag forming with the measured move around the 0.50 Fibonacci Retracement area (on 1M chart). 200 SMA, RSI, and Ichimoku Cloud are included in the analysis.
If you enjoy my ideas, feel free to like it and drop in a comment. I love reading your comments below.
Disclosure: This is just my opinion and not any type of financial advice. I enjoy charting and discussing technical analysis . Don't trade based on my advice. Do your own research! #cryptopickk

BCHUSD Long Trade Idea No. 002BCHUSD
Trading Plan
Spot Trade
Buy on Triangle Retest (360- 370)
TP 1 - 405
TP 2 - 428
TP 3 - 450
SL - Below 360

Grabbed my attentionBCH is getting out from the brief bullish consolidation. If the bids keep coming then it has big potential to resume the uptrend strongly. Near term target $480.

BCH hitting resistanceBCH has been under consolidation for the past year. The price will need to break through resistance if the current uptrend is to continue.
Fundamentally,
I think BCH has a future because many institutions with large computing power will profit from becoming a node.

Bitcoin Cash (BCHUSD): Potential Buying Opportunity Explained
Multiple time frame analysis on Bitcoin Cash.
Price action / key levels / structure.
Potential long trade explained.
❤️Please, support this idea with like and comment!❤️


Dave Receives $500 Million Investment from FTX VenturesThe Nasdaq-listed company, Dave has confirmed recently that it has secured an investment worth $500 million from FTX Ventures, a $2 billion venture fund. Through the strategic partnership between West Realm Shires Services, the owner and operator of FTX US and Dave, the companies are planning to accelerate the expansion of the global crypto ecosystem.


BCH big opportunity: BULL world BCH big UPDATE:
HIT HOLY GRAIL LEVEL TWICE on 24th Jan 2022 and 24th Feb 2022.
PI CYCLE BOTTOM GOT PRINTED on 18th March 2022.

Bitcoin Cash 1W: Long-Term Bullish Scenario (+872% Potential)👋 Hello and welcome traders to another trade idea with SunnyHillCapital
☝️ Firstly, if you like what you see, please support our work by writing a comment and SMASH that like button! 👍 Let's catch these moves together! ✅
💡 Why should you follow our profile on TradingView?
Consistent chart updates
Clean charts
Short and long-term perspectives
Visually teaches you valuable lessons
High probability setups
Analysis on a wide range of major markets
SMASH that follow button! 👍
💡 Leave a comment and/or message us on how we can improve and provide better content, we are open to suggestions to create a better experience for you!
Keep in mind that the analysis provided is not 100% accurate and that you can never be certain with the markets. This information given is not financial advice, always do your own research.
Thank you for reading,
Cheers to many pips! 🤝

