BCHUSD Go ShortPullback Is done, Now it's gonna drop again.
Key Levels
Sell @ 425.00
Stop Loss @ 445.00
Take Profit @ 375.00
Use the trailing stop methods for short term trades.
BCHUSD trade ideas

BITCOIN CASH SHORT ON H1 H1
~Downward structure and bearish tendency
~Price has rejected minor bearish order block for a bearish pullback
~Price is below supply ,we should expect a sell on H1

BCH/USD - Wave 5 in case of a bullish continuationIn case of a bullish continuation and a wave 5 together with bitcoin, this could lead to a 3k-5k in price considering the fibonacci levels.
It is not certain yet that a wave 5 will follow. If bitcoin does not manage to proceed with a wave 5 during the next month or two, this idea might get invalidated.

ETH Monthly ChartETH is showing a pattern similar to a rising wedge pattern on the monthly chart. If price levels stick within the boundaries of this triangle then there will be stronger evidence that this pattern might be a rising wedge (bearish pattern).

BCH Next - $850, $1.1k, $1.4k Mid - $1.8k-$2.4k Long - $4k?BCH Next - $850, $1.1k, $1.4k Mid - $1.8k-$2.4k Long - $4k?
Refer to previous Targets -

BchAs we tap this same support again I’d long here with stoploss below at 420. Take profit 486 as potential back test of old support. Or move stops up into profit as you go ! Good luck I’m in

A Wonderful Buy The Dip Opportunity of Bitcoin Cash (BCH)Down channel:
On the daily time frame since the month of May 2021 the price action of Bitcoin cash is moving in down the channel. After hitting the support of this down channel on 22nd June the price line reached the resistance and for the past several days, the price action is still moving at the resistance of this down channel and not reaching the support again.
Support and resistance and SMAs:
On the weekly time frame it can be seen that after getting rejected by the strong resistance of $1,600 the price line of Bitcoin cash has moved down drastically. It can be also observed that priceline has finally found very strong support at $400 level and this is key level support for the price action of BCH. Because previously it has been working as a support and resistance as well.
Now the next resistance is at $600, $750, $1000, $1600, $1800, $2200, $3000 and $4000 respectively.
At the same time, the price action is also moving at the 50 simple moving average support and after that, we have the 100 simple moving average support on the same weekly time frame chart.
Big shark:
On the 4-day chart, the price action o BCH has formed a bullish Shark pattern. The priceline has already visited the oversold zone as it was dropped up to $468 and moved up. However, this time the priceline has completely entered the buying zone of bullish Shark and giving another chance to catch it from the buying zone of this pattern. There is also 100 simple moving average support in the potential reversal zone. The buy and sell targets as per the Fibonacci sequence of this bullish Shark are:
Buy between: $530 to $340
Sell between: $789 to $1265.42
The maximum extent of the potential reversal zone at 1.13 Fib level can be used as stop-loss which is $340. As per the above targets, this trade has a profit possibility of 270%, and a high loss possibility of up to 36%.
Conclusion:
Even though recently the price action of Bitcoin cash faced strong downtrend on the short-term and the mid-term. But the way the price and is moving at the resistance and making several attempts to break out the resistance of the down channel and the formation of a very big bull Shark are signaling a massive break out soon.

Bitcoin Cash (BCH) formed a bullish BAT for upto 18.5% moveHi, dear friends, hope you are well and welcome to the new update on Bitcoin Cash (BCH).
On the daily time frame chart, the price line of BCH has formed a bullish BAT.

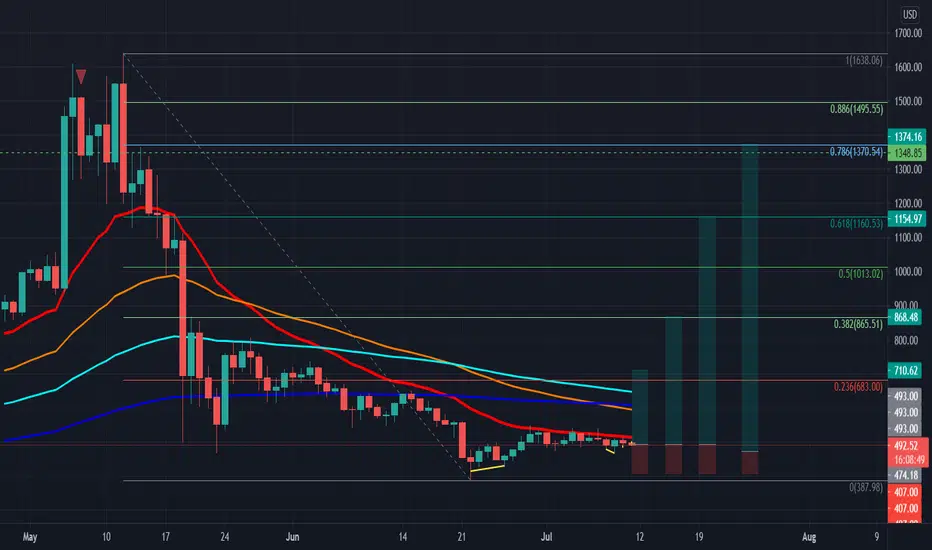
BCH 1D Waiting for Bitcoin Cash at $20,000 and there is no typo)In our portfolio of ideas, a series of accurate predictions for the BCHUSDT pair have gathered, it's time to continue it)
In January 2021, we wrote about buying BCH at $380 and possible sales at $1200
Further in May, they wrote that growth to $1,700 is still possible, and this is what happened, after which the cryptocurrency market collapsed together.
The price of BCHUSD fell by -77% - a lot, but another thing is interesting, the fall was aggressively bought off twice from $380-400 .
That there is an aggressive buyer, we wrote in the previous ideas.
This combination of information suggests that the real bull run on the BCH chart is yet to come.
We think that below $400, buyers will not let the Bitcoin Cash price drop, that is, it is logical to try to gain longs with a grid on a spot in the $400-450 zone.
The first top targets are $1500-1650.
Correction to $750 and you can dream of moving towards ATH, which is close to $4000.
If the holders of 2017 say: $4000 is not enough for us - this is just our break-even point, but how can we make money?, We will say - it is not a problem)
For you, the market has the levels for growth of $12,000 and $20,000 , respectively)
We will take this global idea as a basis and as we grow, we will add additions to it.
Therefore, write a comment under the idea and put like for that you received update notifications in future
_______________________________
Since 2016, we have been analyzing and trading the cryptocurrency market.
We transform our knowledge, trading moods and experience into ideas. Each "like under the idea" boosts the level of our happiness by 0.05%. If we help you to be calmer and richer - help us to be happier :)

Bitcoin Cash (BCH) - July 12Hello?
Welcome, traders.
By "following", you can always get new information quickly.
Please also click "Like".
Have a good day.
-------------------------------------
(BCHUSD 1W Chart)
If the price continues to rise above the 517.20-624.90 section, it is expected to create a new wave.
The 517.20 point and below are the bottom box section and there is a possibility of entering the mid- to long-term investment area, so careful trading is required.
However, if the price is maintained above the 332.38 point, it is likely to turn into an uptrend, so you should think about how to trade it.
(1D chart)
The section 486.28-599.87 is an important section that determines the direction.
If the price maintains the price above the 599.87 point, it is expected to revert to an upward trend and continue the upward trend.
If it falls in the 435.70-486.28 section, it is possible to enter the mid- to long-term investment area, so careful trading is required.
However, careful trading is required as it may touch near the 332.38 point and rise.
-------------------------------------
(BCHBTC 1W chart)
It remains to be seen if they can create a new wave by holding the price above the 0.024438-0.034064 range.
(1D chart)
The 0.014655-0.016063 interval is an important interval that determines the direction.
If it falls in the 0.013651-0.014655 range, it is possible to enter the mid- to long-term investment area, so careful trading is required.
If the price is maintained above the 0.016063 point, it is expected to turn into an uptrend and continue the uptrend.
------------------------------------------
We recommend that you trade with your average unit price.
This is because, if the price is below your average unit price, whether it is in an uptrend or in a downtrend, there is a high possibility that you will not be able to get a big profit due to the psychological burden.
The center of all trading starts with the average unit price at which you start trading.
If you ignore this, you may be trading in the wrong direction.
Therefore, it is important to find a way to lower the average unit price and adjust the proportion of the investment, ultimately allowing the funds corresponding to the profits to regenerate themselves.
------------------------------------------------------------ -----------------------------------------------------
** All indicators are lagging indicators.
Therefore, it is important to be aware that the indicator moves accordingly with the movement of price and volume.
However, for the sake of convenience, we are talking in reverse for the interpretation of the indicator.
** The wRSI_SR indicator is an indicator created by adding settings and options to the existing Stochastic RSI indicator.
Therefore, the interpretation is the same as the traditional Stochastic RSI indicator. (K, D line -> R, S line)
** The OBV indicator was re-created by applying a formula to the DepthHouse Trading indicator, an indicator disclosed by oh92. (Thanks for this.)
** See support, resistance, and abbreviation points.
** Support or resistance is based on the closing price of the 1D chart.
** All descriptions are for reference only and do not guarantee a profit or loss in investment.
Explanation of abbreviations displayed in the chart
R: A point or section of resistance that requires a response to preserve profits.
S-L : Stop Loss point or section
S: A point or section where you can buy to make a profit as a support point or section.
(Short-term Stop Loss can be said to be a point where profit and loss can be preserved or additional entry can be made through split trading. It is a short-term investment perspective.)
GAP refers to the difference in prices that occurred when the stock market, CME, and BAKKT exchanges were closed because they are not traded 24 hours a day.
G1 : Closing price when closed
G2: Opening price
(Example) Gap (G1-G2)


BCH Sell the downtrend.BCHUSD - Intraday - We look to Sell at 538.4 (stop at 561.1)
Daily signals are bearish.
20 1day EMA is at 525.0.
Trend line resistance is located at 538.0.
Preferred trade is to sell into rallies.
Our outlook is bearish.
Our profit targets will be 481.1 and 471.1
Resistance: 525.0 / 540.0 / 550.0
Support: 510.0 / 500.0 / 490.0

Bitcoin Cash Channelling Higher Towards 650Disclaimer
The views expressed are mine and do not represent the views of my employers and business partners. Persons acting on these recommendations are doing so at their own risk. These recommendations are not a solicitation to buy or to sell but are for purely discussion purposes. At the time publishing, I have a position in Bitcoin Cash.
Trend Analysis
The main view of this trade idea is on the 2-Hour chart. The cryptocurrency is in an upward trend channel, with the lows around the 386 and 488 price levels. Also based on a market profile, Bitcoin Cash is currently trading within a confluence or support/resistance zone, which would indicate some level of consolidation and choppiness.
Technical Indicators
Bitcoin Cash recently crossed above its short (25-SMA), medium (75-SMA) and fractal moving averages as it held the lower support trend channel. The RSI also crossed around the same time that support was held. Moreover, the KST confirmed the bullish move with a positive crossover.
Recommendation
The recommendation will be to go long at market. At the time of publishing Bitcoin Cash is trading around 531.75. The medium-term target price is observed around the 650 price level, which is the bottom at the confluence zone while a stop loss should be set around the 490 price level. This produces a risk-reward ratio of 2.83.

BCHUSD Curved ChannelAn idea for BCH
Included how I believe the MA's will play out, they can be identified with the arrow on the end
The curve provides a massive support
Even at the previous ATH it is a massive increase from where we are now


BCH Bitcoin Cash Bullish Trendline BreakoutBitcoin Cash BCH about to breakout of trendline support resistance line.
Bullish Divergence also forming on Williams Vix Fix.
Same pattern occuring on Litecoin LTC, which makes sense since they
are closely correlated cryptocurrencies.


Bitcoin cash looks like could play out the same as OMG yesterday which did good double bottom broke up find support and bitcoin cash find a double support 1 on top of last bottom high and a double bottom day candle


BCH/USD ($400 Range Strong Support?)💎Technical Analysis Summary💎
BCH/USD
-Bitcoin Cash weekly view is back at the key area of interest
-The 400 dollar range may act as a strong buying oppurtunity for long term
-Our main guide here is the long term trendline from Dec 2018 up to the current date
-I think if BCH can hold the 400 dollar support until the end of this year
-The chance we can expect an upside move increase in the coming 6-12 months
-Take note this is on the weekly time frame, a lot of things may happen
-So you should approach this idea with an investor mindset, not a typical swing trade analysis
-Good luck everyone! happy trading! :)
⚠️Please always read the description⚠️
Thanks for donating 💰 via Tradingview coins TiborVrbovsky 🙏🎉
``````````````````````````````````````````````
If you need help🙋 don't hesitate to
Send me a message here PolarHusk 😊
``````````````````````````````````````````````
Trading Involves High Risk ⚠️
Not Financial Advice 💸
Please Exercise Risk Management 💱
``````````````````````````````````````````````


Bitcoin Cash - HIGHLY undervalued! Cup and Handle in the making!MY LAST BCH CHART HIT THE LOW ON THE T!! ACCURACY AT ITS FINEST!! SEE BELOW FOR MY OLD CHART ;)
The ELITES will win this game and they are causing fear in the market so they can buy cheaper. DO NOT LET THEM WIN THIS TIME! Facts are in the charts!
Everything is on the chart! Dips/Corrections are normal and needed in a bull market, and are BUYING OPPORTUNITIES! HUGE GAIN opportunity in the coming months!!. On the chart, Stochastic RSI is about to cross on the weekly again. We need confirmation end of the week. RSI is clearly oversold on the weekly! NEVER TRADE BLINDLY. USE MULTIPLE INDICATORS TO MAKE CALCULATED DECISIONS. TRADE WITH NO EMOTIONS!!
A BULLISH CUP AND HANDLE IN THE MAKING! THIS TIME WE CHART ON THE MONTHLY!
FACTS:
1. RSI HASN'T BEEN THIS OVERSOLD SINCE SEPTEMBER 2020!
2. NEED A BULLISH CROSS CONFIRMATION ABOVE THE 20 STOCHASTIC RSI LEVEL! WILL MAKE AN ATH ONCE CONFIRMED!
3. CREATING A BULLISH CUP AND HANDLE SINCE 2018!!
4. Cup and Handle Meaning:
Cup and Handle - is considered a bullish signal extending an uptrend, and is used to spot opportunities to go long.
BREAKOUT IS MEASURED BY THE DEPTH OF THE CUP MOVING IT TO THE NECLINKE OF THE BREAKOUT!
TARGET BUY:
1. $463.08 (Correspodnds to 0.786 Fib)
TARGET SELL:
Target 1: $4958 (Corresponds to the 3.618 Fib)
Target 2: $5740 (Corresponds to the 4.236 Fib)
Target 3: $13,000 - 15,000 (Corresponds to the cup and handle breakout from the neckline!)
"If you can't beat the fear, do it scared!"
"Be fearful when others are greedy, and greedy when others are fearful!" - Warren Buffet.
"Markets are a device for transferring money from the impatient to the patient. - Warren Buffet
"Show me the charts, and I'll tell you the news." - Bernard Baruch
