Bitcoin Cash (BCH): Approaching Ideal Buy ZoneBCH is having a sell-off, which could lead us into another buying area near the EMAs. We have seen how well the EMAs have been holding the coin giving proper support to it so that's what we are looking for, for another buying opportunity which would give us a good R:R trade opportunity.
Swallow Academy
BCHUSDT trade ideas

BCHUSDT CAN GO UP TILL $555Though currently market is sideways movement, this coin shows some reversal signs if successfully continue moving upward it reach 555.
That's just my view

Bitcoin Cash: Altcoins Market Bullish Continuation Confirmed!The rise in late 2024, Nov-Dec, lasted only one month. This time the situation is much more different, it confirms what we already know, a major altcoins bull market.
Bitcoin Cash (BCHUSDT) has been growing for 85 days. No strong upthrust with high volatility, but steady growth, the type that exudes strength. At one point there will be a major impulse and this one will be followed by additional growth. What you are seeing is only the start.
Bitcoin Cash helped us predict a continuation of a bullish move for the altcoins several weeks ago. You can reach the same conclusion again. The fact that Bitcoin Cash is bullish now, confirms that the entire altcoins market will continue to grow.
Thank you for reading.
Namaste.

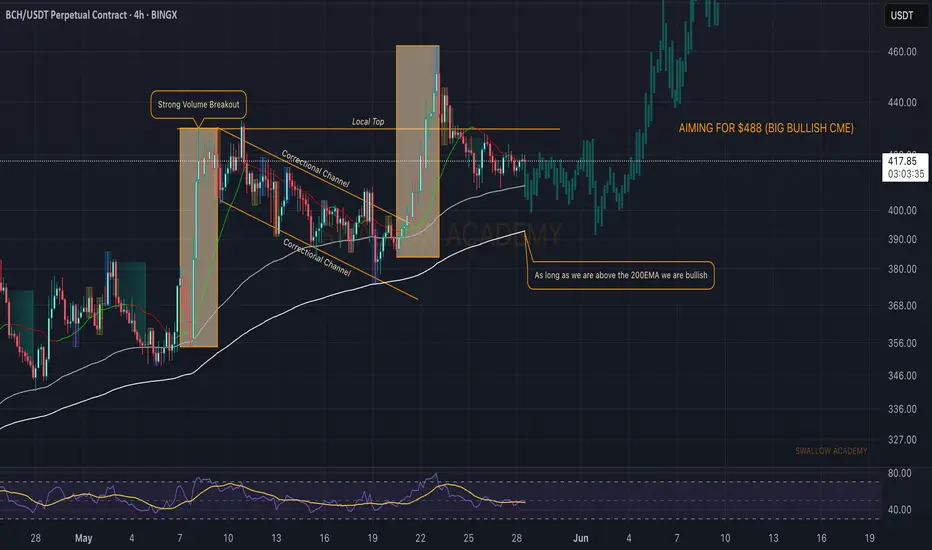
Bitcoin Cash (BCH): Seeing Similar Pattern | Next Target $488BCH has reached our previous target, and after reaching the local top, we have been having a slight downside movement. What we are seeing is the similar pattern where we are looking yet for another movement like last time.
Overall, we are aiming to see the $488 area reached, where we have a HUGE CME gap waiting to be filled.
P.S: As long as we are above the 200 EMA, we are bullish.
Swallow Academy
Is #BCH About to Fall or Will it Continue to Rise? Key LevelsYello Paradisers! Have you seen what’s cooking on #BCHUSDT lately? Let’s dive into the latest structure on #BitcoinCash and what may unfold next:
💎#BCH has been trading within a well-respected ascending channel since early April, consistently bouncing between dynamic ascending support and resistance levels. However, the current move into the $500–$505 resistance zone is showing clear signs of momentum exhaustion, as price stalls and volume fades.
💎The strong resistance area between $500 and $505 has rejected price multiple times, and this recent rejection aligns with both the channel resistance and a bearish momentum divergence in volume. Unless #BCHUSD can break and hold above this zone, bulls are fighting a losing battle.
💎The invalidation of the bearish setup lies above $555. Only a confirmed breakout and sustained hold above this level would negate the current bearish structure and open room for a larger bullish expansion. Until then, the risk of a deeper retracement is very real.
💎Currently trading around $490, #BCH looks vulnerable to a drop toward the moderate support zone near $393, with the strong demand zone between $335 and $340 being the high-probability area for a smart-money reaccumulation—if the market flushes weak hands first. This zone also lines up with previous high-volume nodes on the VRVP.
Trade smart, Paradisers. This setup will reward only the disciplined.
MyCryptoParadise
iFeel the success🌴

BCHUSDT Bullish setupBCHUSDT is showing a bullish setup. Despite overbought RSI levels, BCHUSD continued to make a new higher high (HH), indicating strong bullish momentum."

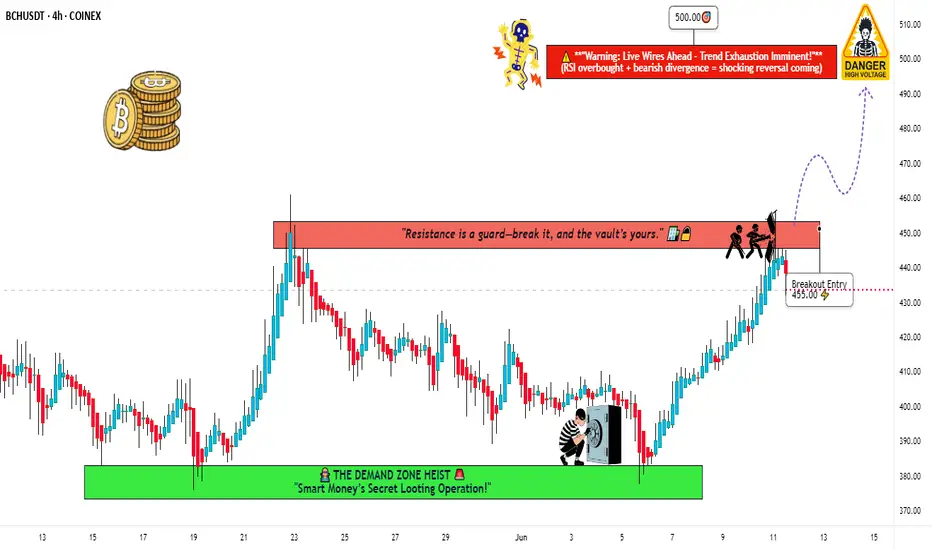
BCH/USDT Robbery Blueprint | Bullish Breakout Swing Trade Setup🚨 BCH/USDT Robbery Blueprint: The "Breakout Bandits" Bullish Heist Plan! 🚨
(Thief Trading Style – Swing Trade Setup)
🌟Hi! Hola! Ola! Bonjour! Hallo! Marhaba!🌟
Dear Money Makers & Market Robbers, 🤑💰💸✈️
We're about to pull off a high-stakes breakout heist on the BCH/USDT “BitcoinCash vs Tether” crypto market using the legendary 🔥Thief Trading Style🔥 — powered by technical + fundamental recon.
🎯 Mission Objective: Long Entry
"The vault is cracking open... our move starts above the 455.00 MA breakout level. Set your traps smart!"
✅ Buy Stop: Above MA @ 455.00 – The breakout point to initiate the heist.
✅ Buy Limit: Look for pullbacks on 15m or 30m swings for a sneaky entry at key levels.
📌 Set an alarm – don’t blink or you’ll miss the breach!
🛑 Escape Plan – Stop Loss
🔊 Yo crew, hear this:
If you're rolling with a buy stop, don’t drop your stop loss too early – wait till we’re inside!
📍 Ideal SL @ 425.00 on 4H swing lows — keep it smart, based on risk + lot sizing.
You’re the captain of this getaway — protect the loot!
🏴☠️ Target Zone
💰Profit Point: 500.00
(or escape earlier if heat increases 🔥)
Get out before the cops (bearish robbers) regroup!
📊 Heist Intelligence:
Market’s flashing bullish vibes, driven by:
🧠 Fundamentals | 📈 Macros | 🧾 COT Report | 🔗 On-chain Data | 🌀 Sentiment | 🔄 Intermarket Forces
👉 Check our bi0 link for the full briefcase of intel 🔍🧠
⚠️ Trading Alert – News & Volatility Risk
📢 Avoid entries during high-impact news
🔒 Use trailing SLs to protect profits + survive crossfire
💖 Show love to the crew! 💥 Hit that Boost Button 💥
Support our robbery squad – grow stronger, smarter, richer!
Trade like a thief. Rob the markets daily. 🎯💪🏆🚀💸
I'll be back soon with another crypto vault raid – stay tuned, legends! 🐱👤🤑🤩
BCHUSDTBitcoin Cash making correction move, it will going up again?
if break low (strong low) BCHUSDT switch trend 📉

Bitcoin Cash (BCH): Seeing Possible Breakout To HappenBitcoin Cash seems to go for a smaller breakout after we had a huge liquidity movement and a correction following it. We had a nice touch to EMAs and bounced from there, where now we are testing the upper side of the bearish channel and buyers are not showing any remorse.
We are looking for a breakout here, which would give us a humble 8% movement to upper zones.
Swallow Academy

Bitcoin Cash (BCH): Seeing Good Shorting OpportunityBitcoin Cash has a good chance to start falling since we recently got rejected from the resistance zone while also filling the bullish CME gap.
If we see the next 4-hour candle or the candle after that to be with a strong red body, then we will have more confirmation of sellers' dominance, which then would mean a movement to the 200 EMA line (near the support zone).
From there we might break the zone and if we break the next target would be near $316, but this will be taken as an option only if we see a clean breakdown!
Swallow Academy

BTC daily time frame updatelets make thinds simple and clean.. i like to share my idea but its only show you big picture so keep it in mind. i dont like to talk too much so watch chart and try to understand it

SCREAMING BULLISHBCH/USDT has nicely rejected the 440 support level. Price is currently consolidating below the 200SMA but i think we will see it break it and continue higher as it did last week.
My target is 485.7
SL is 434.0

Bitcoin Cash price action is interestingBINANCE:BCHUSDT price action in comparison with BTC and the remaining crypto assets price action is signaling that the coin is on to something, I expect this outperformance to continue. Anticipate price action is shown on the chart, long on the pullback towards 10 days moving average, stop level 450$.
PS. My views only, not financial advice!

Bitcoin Cash, Anomaly or Predictive Signal?Some people can say that Bitcoin Cash right now is simply an anomaly, nothing to see here. But a closer look reveals nothing abnormal, more likely a very strong predictive signal that supports what we saw happening with the COIN stock and what was predicted recently to happen with ETHUSDT (Ethereum), that is, a very strong bullish breakout is the next main major market move.
Good morning my fellow Cryptocurrency trader, I hope this day finds you well.
How are you feeling?
Introduction —The market is one
In isolation, the market is tricky and hard to predict. Within a bigger context, we can easily predict what will happen next. Just look at Bitcoin Cash, it shows exactly what will happen because it has been being in perfect syntony with the rest of the market.
Many pairs are consolidating or retracing. My view is that a bullish move comes next.
Let's see how Bitcoin Cash has been behaving lately and compare this to the rest of the market. The fact that it is bullish now predicts that also the other pairs will be bullish because they are moving in the exact same way.
Price action —Past history
A crash ends in early August 2024. By late 2024 the action goes bullish. November 2024 marks the start of a month long advance that ends December 2024. This is true for most of the altcoins market.
The December 2024 peak leads to a correction with the main low happening 3-February. Another low and market bottom happens 7-April 2025. From this point on, we have a recovery and after a high in late May, the market goes into retrace.
Present day
This retrace is where we are today for most of the pairs. 100% of these are trading within a higher low compared to 7-April. Here BCHUSDT ended its retrace and moved ahead of the pack to hit a higher high compared to May. It also produced the highest price since January 2025.
The future
This is not an anomaly. Bitcoin Cash's price action simply reveals what is coming to the rest of the market. As it moved in perfect synchrony with other projects for months or even years, it will continue to do the same. The fact that it is trading higher now, means the other pairs will follow, in fact, some other pairs are already there; a bullish continuation.
Soon everything will grow.
Thank you for reading.
Namaste.

Bitcoin Cash BCH price analysisMore than 3 months have passed since the publication of the previous idea for #BCH, and the price itself has shown an increase of +40%
◆ Slowly but surely growing
◆ Does not react to the price fall CRYPTOCAP:BTC (for those who don't know, #BCH is the first CRYPTOCAP:BTC fork and probably the only one that survived. Then there were 8-10 more of them in 2017-2018... but hey...)
◆ It has been moving in its own direction for more than a year, when OKX:BCHUSDT is cheaper than $300, it is actively bought back by someone.
We have slightly revised the growth target for #BitcoinCash, but why not consider this asset as a long-term investment from $350-400 to $900 and $1250
_____________________
Did you like our analysis? Leave a comment, like, and follow to get more

BCH ANALYSIS🔆#BCH Analysis : Channel Following ⛔️⛔️
As we can see that #BCH is following ascending channel on daily time frame. Also there is an instant resistance area. We can see a bullish formation here. And if it trade with good volume then we can see a proper bullish move in #BCH
🔖 Current Price: $463
⏳ Target Price: $598
⁉️ What to do?
- Keep your eyes on the chart, observe trading volume and stay accustom to market moves.🚀💸
#BCH #Cryptocurrency #ChartPattern #DYOR

BCH Breaks Structure – Wave C Target in Sight?BCHUSDT Update:
After weeks of slow movement, BCH is finally breaking above the key resistance zone—a level that has acted as a strong barrier multiple times in the past.
This breakout is significant because it aligns with multiple technical confirmations. The support trendline has held firmly, a higher low has been established, and the price has pushed upward from a well-defined area of confluence.
If this breakout sustains, there is a strong possibility of continuation toward the upper resistance zone, completing the projected wave structure. It’s important to monitor this closely, as a successful retest and follow-through could confirm the beginning of the next bullish phase.
Thank you for your precious time.

Bitcoin Cash Weekly Update, Moving Averages & Bullish PotentialI already looked at Bitcoin Cash recently, this time I want to see how the moving averages are doing here to compare with the other Crypto-projects. Good news for one pair is good news for other projects as well specially when they are in the same category. Bitcoin Cash is one of the big projects.
Here we can see BCHUSDT trading weekly above EMA34, EMA89 and MA200, while rising.
Resistance was found at $453, a fib. extension level. Once this level is broken as resistance you can expect a swift advance toward $680. It will be nice and easy. This is the last barrier and current price action is kind of mix.
It is good because this week trades at the highest since November 2024 coming from a low. It is bad because it is lower compared to 19-May on the wick but the week is yet to close.
A weekly close above $420 is highly desirable and favors the bulls, anything lower and we continue with a mixed situation. Make no mistake, the situation is mixed only short-term. The chart shows a clear bullish bias and there will be additional growth in the coming weeks and months. Only the short-term is questionable.
Bitcoin Cash, Bitcoin and the entire Cryptocurrency market is set to grow.
Thanks a lot for your continued support.
Namaste.

Bitcoin Cash Early Recovery & Bullish ContinuationToday's candle says it all. Bitcoin Cash moved to hit a low of $397, today, and the same session now trades at $449, the highest price since 23-May which was the date that produced the highest price since January 2025. This is an early recovery signal.
This signal is good and great but it needs one final bit to be confirmed, and that is a continuation tomorrow. The week is about to end and the close is what determines the next move. If the action closes above the 23-May high, $462, then ultra-bullish confirmed. If the session closes below then there is still room for some more shakeouts, retraces and corrections. But the early recovery signal is in. What one does, the rest follows.
Now, not all pairs will move in the same way. Some will continue lower, retrace, while some others produce an early recovery and move ahead.
Today's session is just too strong, we can easily say that Bitcoin Cash is ready to resume its bullish wave of growth. $684 next target, followed by additional growth.
Thanks a lot for your continued support.
Namaste.

Bitcoin Cash (BCH): Breakout Incoming | Possible 1:4 TradeBCH is showing signs of a breakout where price is pushing and pushing, which eventually might result in a strong and volatile breakout from here.
As soon as we see it, we will be looking for further upward movement towards our target zone (resistance area).
Swallow Academy

Everything Bitcoin Cash Points To a New ATH; $2,600 or $4,150?Bitcoin Cash is bullish, ready to grow within the bullish zone. There is zero doubt. I think it will be hard to know if the peak will happen around $2,600 or $4,150. There is a huge difference.
Knowing how erratic BCH has been in the past, we have to go with the second higher target; what do you think?
It is hard to say but we have two targets mainly for late 2025. There is no doubt that we will get a new all-time high we just don't know how high.
I will go with the second one just in case. Say this bull market top for Bitcoin Cash will reach somewhere around $4,000. Can be more or less.
You can leave a comment with your number.
How far up do you think Bitcoin Cash will go?
And remember, the bullish bias is already confirmed. Everything points up. The chart, the indicators, the patterns, the signals, the overall market, everything... Thank you for your continued support.
If you enjoy the content make sure to follow.
Namaste.

BCH/USDT – Symmetrical triangle breakdown confirmedBCH/USDT – Symmetrical triangle breakdown confirmed
BCH has broken down from the symmetrical triangle pattern, signaling a bearish shift in momentum. If the price continues to trade below the breakdown level with increased volume, further downside can be expected.
Key levels to watch:
* Breakdown resistance zone
* Retest confirmation
* Next support levels below
Monitor closely — staying below the triangle support may lead to extended bearish movement.

Bitcoin Cash Respects Trendline Again – Is Another Rally LoadingBitcoin Cash is showing strong trendline respect, with multiple successful bounces from the ascending support.
Price is once again bouncing off this trendline, signaling bullish intent. As long as this structure holds, the uptrend remains intact and a potential move toward higher levels looks likely.
Key support and trendline confluence continues to act as a launchpad.
