Bitcoin Cash $2,615 Minimum · $4,178 Possible · Plan Ahead105 days. This is definitely the longest stretch of bullish action since 2021. Bitcoin Cash has been growing non-stop for 105 days.
If someone told you this would be the case some months ago or a few years back you wouldn't believe it. What if someone tells you now that you've seen nothing yet? What if I told you that the best is yet to come? This is only the build-up process. Bitcoin Cash is about to shoot up really strong. It will skew the chart. People won't be able to comprehend what is happening less adapt to the market. It will be chaos, bullish chaos.
Years of consolidation. Bitcoin Cash has been on a wide trading range since February 2024. We can easily say since mid-2023 if we consider using a wider range. This is all the build-up process for this moment now. The 2025 bull market. Predicted years ago, now it cannot be denied, it is right in your face.
Let's play the other side for entertainment's sake. Bitcoin Cash stops rising, either a lower high now or a reversal at the December or April 2024 high. What would happen then? A bear market? No! Just a down-wave, more consolidation before the final advance, price jump and market bull run.
Let's go back to reality for accuracy's sake. Bitcoin Cash will grow in bullish momentum and will break all resistance one next to the other, stops will be short. If there is a correction in-between the action, it won't be long.
Look back to the 2021 bullish wave, the fifth wave; notice three weeks red, two weeks red, one week red, etc., in-between the rising wave. Straight up but obviously, there are some stops. When we are in the experience, when it is happening, these weeks feel like forever and we never know if it will continue rising or if that's it, we reached the end. I am telling you now, it will not be over until a major new all-time high hits, and the levels are being shown now. When we are more advanced in the market cycle, I will not try to predict the short-term. Instead, I will tell you to secure profits and move on. Once prices are really high, close your position and start looking for the ones still trading low near support. Of course, writing this won't change anything, people will still be attracted to the action and mistakes will be the norm. Only if you bought early when prices were low, you will be able to withstand the market pressure. If you buy late, the market will kill you and take everything from you. This is a friendly reminder. Plan ahead.
Namaste.
BCHUSDT trade ideas

Bitcoin Cash (BCH): Looking For Touch To 200EMABCH looks overbought to us, and where we are now, we are looking for another touch to that 200 EMA, which would give us another good opportunity for long, so the plan is simple and that's what we are looking for.
Repeat of history, as they say!
Swallow Academy

BCH Lights Up Across Multiple Timeframes A Breakout Sequence 🚨 SET:BCH is unleashing strength across all major timeframes—and it’s not subtle.
📆 Daily: Defying the norm by breaking up from a rising wedge 📈
🗓️ 3-Day: Clean breakout above a descending trendline—momentum building 🔓
📅 Weekly: Exploding out of a long-standing pennant formation 🚩
This isn’t just another pump—it’s a multi-timeframe alignment, one of the strongest confirmation signals for technical traders. Price is currently in retest mode, and if support holds, the rally could accelerate fast ⚡
🧠 Grok Insights: Breakouts confirmed on 3+ timeframes see 2.6x higher continuation probability within the next 5–10 candles. BCH’s structure hits that mark.
👀 High-alert zone — this setup is rare, clean, and potentially explosive.
Do you see continuation from here, or is this a bull trap in disguise? Let’s talk.
Not financial advice.
Liquidity Sweep + FVG + RSIThis BCH/USDT 2H chart illustrates a textbook example of a liquidity sweep and reversal, backed by RSI confluence. Price repeatedly tested a horizontal resistance level, eventually triggering a breakout trap — enticing late buyers just before reversing.
The false breakout swept buy-side liquidity, trapping retail longs above resistance. Immediately after, price dropped back below the key level and formed a Fair Value Gap (FVG) — a common area where smart money re-enters positions. This signaled distribution rather than continuation.
Adding to the bearish confluence, RSI showed overbought conditions during the sweep, reinforcing that momentum was exhausted. Once liquidity was taken and RSI began dropping, a strong bearish move followed.
📉This setup combines multiple Smart Money Concepts:
🔁Liquidity engineering
🔁Breakout trap
🔁Fair Value Gap re-entry
🔁RSI confirmation

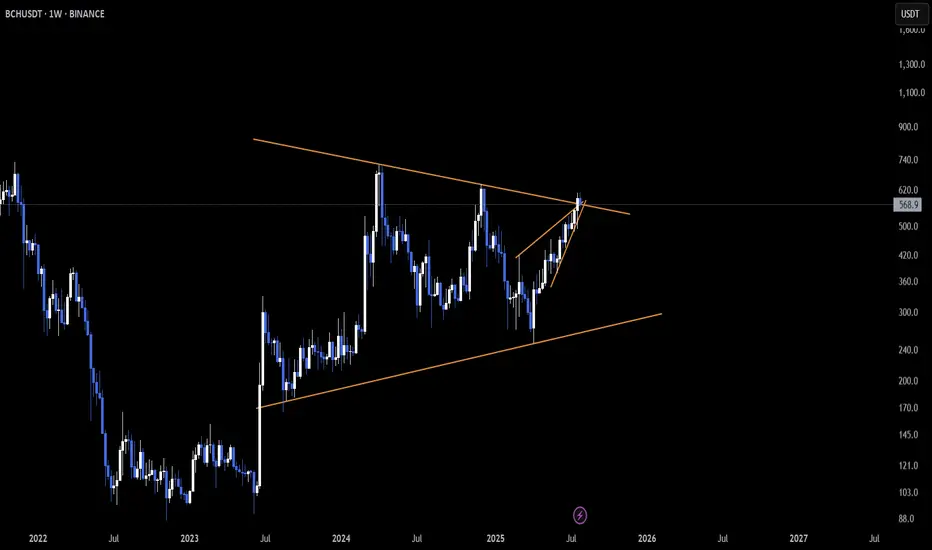
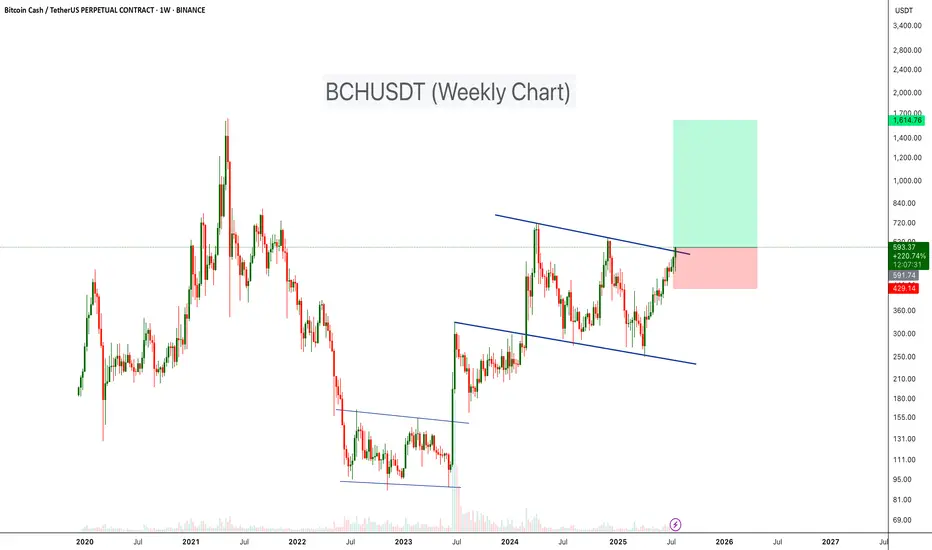
BCHUSDT Bullish ChannelBCH is currently testing the upper resistance of a long-term descending channel on the weekly timeframe, a level that has historically acted as strong resistance. After months of consolidation and a healthy recovery structure, BCH is once again knocking on the door of a major trendline breakout.
The price has steadily recovered from the lows near $250 and is now hovering around $590. A confirmed breakout above this descending trendline could trigger a larger bullish continuation, potentially propelling BCH toward the $1,600–$1,700 zone.
Cheers
Hexa🧘♀️
Bitcoin Cash Reclaims Momentum – Explosive Move Ahead?CRYPTOCAP:BCH Weekly Breakout 🚨
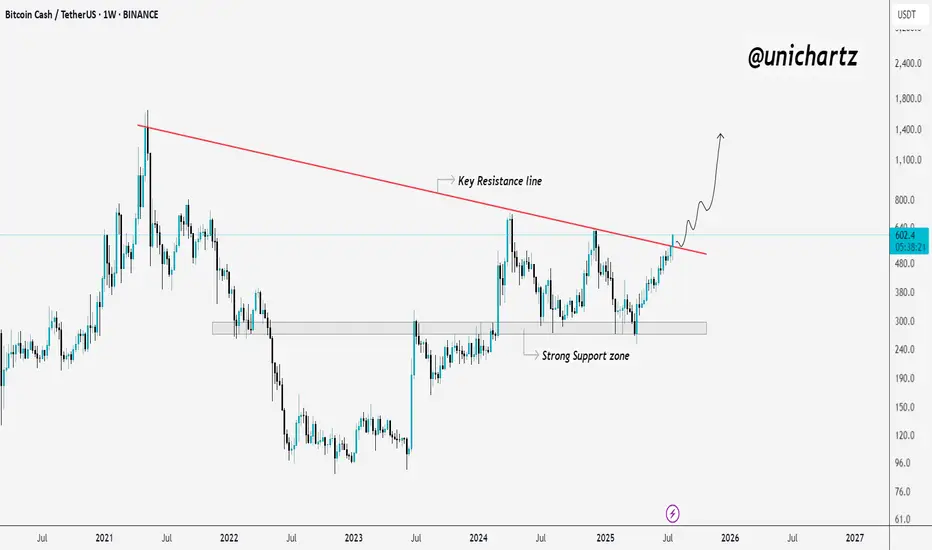
Bitcoin Cash just broke above a key multi-year resistance line, and that’s a big deal.
After months of consolidation above strong support, this breakout could trigger a powerful upside move.
If momentum holds, BCH might be gearing up for a run toward $800 and beyond.
Looks like the real move is just getting started.
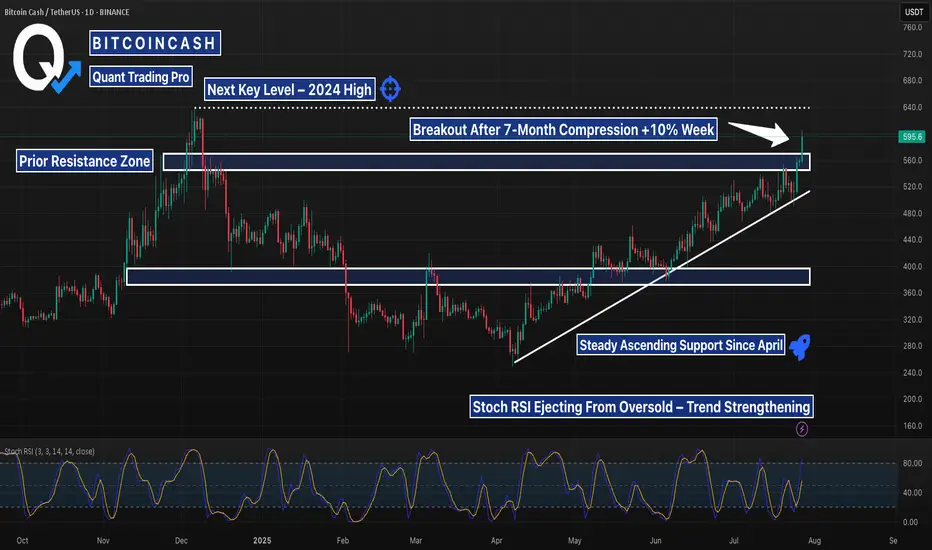
BCH Breaks Out of 7-Month Range — Eyes Set on 2024 HighsBCHUSDT 1D chart shows a clean technical breakout after months of slow grinding structure. Price has officially pushed through the $570–$580 resistance that’s capped upside since December 2023. This move comes on growing volume and renewed interest in BCH across crypto forums and analyst posts, with some calling it a long-overdue move for a top-20 coin.
The prior resistance zone around $430–$470 acted as a major accumulation range — now flipping into solid support. Price is also respecting a long-standing ascending trendline since April, showing consistent higher lows and steady bullish structure.
Stochastic RSI confirms momentum is shifting — pushing out of the mid-zone and suggesting trend continuation. With this breakout confirmed, the next major target sits near $640: the high from late 2024.
If BCH holds this breakout, it may be entering a new expansion phase. Watch for possible retests of $570–580, but structure favors bulls.
#BCH Update #3 – July 31, 2025#BCH Update #3 – July 31, 2025
From a technical standpoint, Bitcoin Cash is currently one of the best rounding coins compared to others, and it hasn't broken its upward channel. It continues to move steadily within the trend.
It recently took support from the midline of the channel and made a move, though this move wasn’t very large — it stayed around a 4-5% profit range. It has now completed its correction, but if it drops back to the bottom of the channel and then rises again, the profit potential would be even higher. At the moment, there’s only about 4% upward space left before it meets the top resistance of the channel.
Bitcoin Cash is currently one of the most technically clean and consistent altcoins. If it pulls back slightly, it might be a better entry, but there’s no issue with entering from this level either. Therefore, I’m opening a 4.5% position here, with a profit expectation of 4.5%.

Bitcoin Cash (BCH): Breakout Incoming | Possible 1:4 TradeBCH is showing signs of a breakout where price is pushing and pushing, which eventually might result in a strong and volatile breakout from here.
As soon as we see it, we will be looking for further upward movement towards our target zone (resistance area).
Swallow Academy

#BCH Update #2 – July 27, 2025#BCH Update #2 – July 27, 2025
After its last impulsive move, Bitcoin Cash experienced a full retracement. However, it managed to maintain its bullish structure by avoiding a close below its previous low.
At this point, it has reached its target and is still climbing. However, buying from here is a completely risky move. From a technical analysis perspective, Bitcoin Cash has already reached the extent of its potential upside.
Starting from this point forward, I absolutely do not recommend any long positions in Bitcoin Cash. Due to potential profit-taking by whales, a sharp correction is very likely.
I’ll provide updates as the situation develops, but for now, Bitcoin Cash is not in a suitable position for opening long trades. It has reached its target. Therefore, the best action at this stage is to wait.

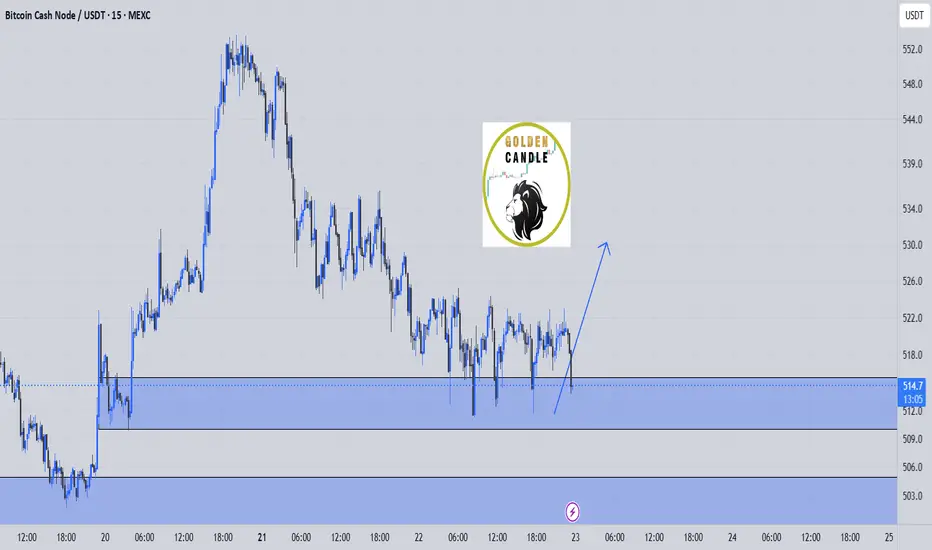
bch buy midterm"🌟 Welcome to Golden Candle! 🌟
We're a team of 📈 passionate traders 📉 who love sharing our 🔍 technical analysis insights 🔎 with the TradingView community. 🌎
Our goal is to provide 💡 valuable perspectives 💡 on market trends and patterns, but 🚫 please note that our analyses are not intended as buy or sell recommendations. 🚫
Instead, they reflect our own 💭 personal attitudes and thoughts. 💭
Follow along and 📚 learn 📚 from our analyses! 📊💡"
#BCH Update #1 – July 15, 2025#BCH Update #1 – July 15, 2025
Bitcoin Cash appears to have completed the correction of its latest impulsive move. The retracement ended at the 0.786 Fibonacci level, which also coincides with the 200 MA — a strong technical support zone.
Given this confluence, I opened a Long position targeting a 5% profit. I am not using a stop-loss because I plan to lower my average entry by adding more from lower levels if needed. Technically, the setup looks favorable for a Long trade at this point.

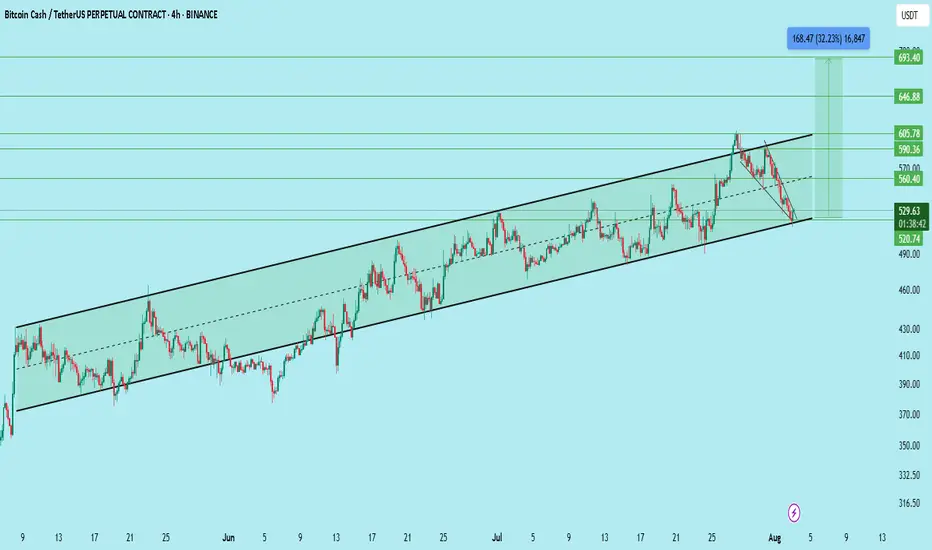
BCHUSDT : Potential Long Setup – Trendline Support Falling WedgeBCH has been trading in a well-defined ascending channel on the 4H chart. After multiple higher highs and higher lows, price recently corrected to the channel support and formed a falling wedge — a bullish reversal pattern.
Current Price: ~$528
Entry Zone: $520–$540
Stop Loss: Below $495 (clean invalidation below channel support)
Targets:
TP1: $560
TP2: $590
TP3: $605
TP4: $646
TP5: $693
Potential Upside: +32% from entry zone
Analysis:
The falling wedge breakout near channel support confirms buyer interest.
Volume drop during the correction phase supports bullish reversal conditions.
Risk-reward ratio favorable near the channel low.
Trade Plan:
Start building position between $520–$540 using DCA. Keep SL below $495. Expect gradual move toward the upper resistance zones if the breakout sustains.
Watch for breakout confirmation above $540–$550 for momentum entry.
DYOR | Not Financial Advice
buy bch midterm"🌟 Welcome to Golden Candle! 🌟
We're a team of 📈 passionate traders 📉 who love sharing our 🔍 technical analysis insights 🔎 with the TradingView community. 🌎
Our goal is to provide 💡 valuable perspectives 💡 on market trends and patterns, but 🚫 please note that our analyses are not intended as buy or sell recommendations. 🚫
Instead, they reflect our own 💭 personal attitudes and thoughts. 💭
Follow along and 📚 learn 📚 from our analyses! 📊💡"

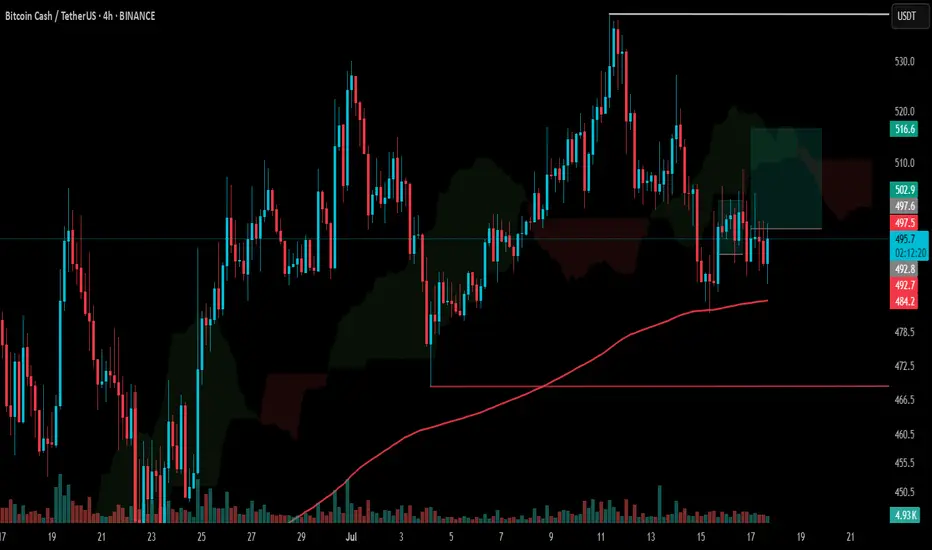
#BCH Update #2 – July 18, 2025#BCH Update #2 – July 18, 2025
Bitcoin Cash completed a correction after its previous impulsive move, but within that correction, a secondary retracement occurred. This brought the price down to the edge of the 200 MA zone. The MA200 acted as strong support and triggered a reaction.
Despite experiencing another minor pullback, the current structure still appears favorable for Long entries. As shown in the chart, a Long position is already open. I haven’t set a stop-loss because I have enough capital to average down if needed.
For those looking to enter, this could be a good opportunity.
Bitcoin Cash (BCH): Going For Another Rally | Bounce From EMAsBCH is back near EMAs, where we have been having a decent rally after a touch to that zone. 100 and 200EMAs have been holding the bullish trend quite well, and now with combined bullish CME we see that upside movement is going to happen with high probability.
We are longing, are you?
Swallow Academy

Bull Market Action Exposed—Bitcoin Cash Growing 91 Days Non-StopWhat we are seeing now is very different compared to the past. If you look at early 2024 the rise was composed of strong big candles, always fast as if in a hurry. Very strong growth. If we go further and consider late 2024, we got a lower high but still very big candles. Fast forward to present day 2025, and we have a perfect uptrend, prices rising week after week after week with relatively small candles, some medium-sized but not as big as before. This is bull market action.
In the past, the candles were really big because the bullish action was soon to end, it wasn't expected to last a long time and thus everything needs to be accomplished fast. Things are different now. The fact that we have slow and steady growth is good news. Since the market is going to be growing for a prolonged period of time, the candles are smaller.
Don't be fooled by current price action, it all ends up in a major bull-run. While the candles are small now you can take it as bullish consolidation. Prices are growing but this is still a sort of accumulation/build-up phase. Everything is building up to a very strong climax with new all-time highs all-across and then some more.
Bitcoin Cash has been growing straight up for 91 days. In June 2023, Bitcoin Cash produced only two weeks green. Back in late 2024 all the growth happened in 28 days. Early 2024 56 days was all that was needed and then the market turned red. This is the longest stretch of continued growth since 2021... Yes, the previous bull market. You are witnessing bull market action.
Thanks a lot for your continued support.
Namaste.

BCHUSDTBitcoin Cash making correction move, it will going up again?
if break low (strong low) BCHUSDT switch trend 📉

BCHUSDT CAN GO UP TILL $555Though currently market is sideways movement, this coin shows some reversal signs if successfully continue moving upward it reach 555.
That's just my view

Bitcoin Cash (BCH): Approaching Ideal Buy ZoneBCH is having a sell-off, which could lead us into another buying area near the EMAs. We have seen how well the EMAs have been holding the coin giving proper support to it so that's what we are looking for, for another buying opportunity which would give us a good R:R trade opportunity.
Swallow Academy

Bitcoin Cash: Altcoins Market Bullish Continuation Confirmed!The rise in late 2024, Nov-Dec, lasted only one month. This time the situation is much more different, it confirms what we already know, a major altcoins bull market.
Bitcoin Cash (BCHUSDT) has been growing for 85 days. No strong upthrust with high volatility, but steady growth, the type that exudes strength. At one point there will be a major impulse and this one will be followed by additional growth. What you are seeing is only the start.
Bitcoin Cash helped us predict a continuation of a bullish move for the altcoins several weeks ago. You can reach the same conclusion again. The fact that Bitcoin Cash is bullish now, confirms that the entire altcoins market will continue to grow.
Thank you for reading.
Namaste.

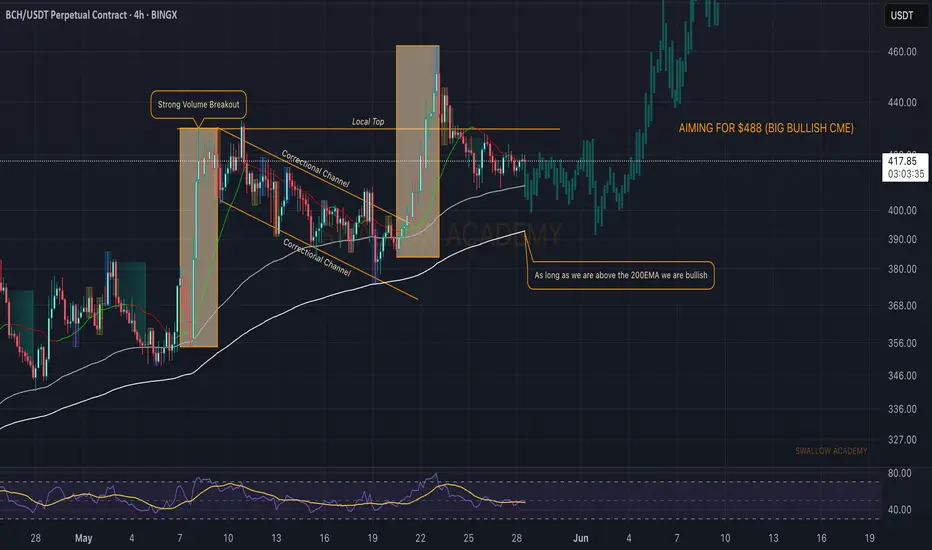
Bitcoin Cash (BCH): Seeing Similar Pattern | Next Target $488BCH has reached our previous target, and after reaching the local top, we have been having a slight downside movement. What we are seeing is the similar pattern where we are looking yet for another movement like last time.
Overall, we are aiming to see the $488 area reached, where we have a HUGE CME gap waiting to be filled.
P.S: As long as we are above the 200 EMA, we are bullish.
Swallow Academy
Is #BCH About to Fall or Will it Continue to Rise? Key LevelsYello Paradisers! Have you seen what’s cooking on #BCHUSDT lately? Let’s dive into the latest structure on #BitcoinCash and what may unfold next:
💎#BCH has been trading within a well-respected ascending channel since early April, consistently bouncing between dynamic ascending support and resistance levels. However, the current move into the $500–$505 resistance zone is showing clear signs of momentum exhaustion, as price stalls and volume fades.
💎The strong resistance area between $500 and $505 has rejected price multiple times, and this recent rejection aligns with both the channel resistance and a bearish momentum divergence in volume. Unless #BCHUSD can break and hold above this zone, bulls are fighting a losing battle.
💎The invalidation of the bearish setup lies above $555. Only a confirmed breakout and sustained hold above this level would negate the current bearish structure and open room for a larger bullish expansion. Until then, the risk of a deeper retracement is very real.
💎Currently trading around $490, #BCH looks vulnerable to a drop toward the moderate support zone near $393, with the strong demand zone between $335 and $340 being the high-probability area for a smart-money reaccumulation—if the market flushes weak hands first. This zone also lines up with previous high-volume nodes on the VRVP.
Trade smart, Paradisers. This setup will reward only the disciplined.
MyCryptoParadise
iFeel the success🌴
